.svg)
.svg)
Supply Chain service level: formulas and how to improve it

Service level measures the proportion of customer demand a Supply Chain fulfills on time and in full. The classic formulas (cycle service level, fill rate, on-time in-full) assume one target across every item. In practice, service level should be segmented by margin, criticality and substitutability, then recalibrated dynamically rather than set once a year.
A 98% service level target sounds healthy. On half your catalogue it is too low. On the other half it is quietly destroying your margin.
That is the paradox most monthly service level reviews never confront. The number on the dashboard is a single average, but the business behind it is anything but. A stockout on a critical part halts a customer's production line. A stockout on a low-margin commodity may not even cost a phone call. Treating the two with the same target is how Supply Chains end up holding the wrong inventory in the wrong places and still missing the orders that matter.
This guide unpacks what service level measures, the formulas every planner should know, and why the "raise the target" reflex is usually wrong. It is written for Supply Chain Directors, Sales and Operations Planning (S&OP) managers and demand planners who suspect the monthly headline is hiding more than it reveals.
What service level actually measures
Service level is the umbrella term for a family of metrics that quantify how well a Supply Chain delivers what its customers ordered, when they ordered it. The three most common are cycle service level, fill rate and on-time in-full (OTIF).
Cycle service level (type 1, or alpha) is the probability of not running out of stock during a replenishment cycle. It is binary: either the cycle closed without a stockout, or it did not. If 95 cycles out of 100 close without a rupture, the cycle service level is 95%. This is the metric that drives safety stock sizing, because it maps directly to a Z-score on a normal distribution.
Fill rate (type 2, or beta) is the proportion of demand fulfilled directly from stock, measured in units, lines or orders. A planner can hit a 95% cycle service level while losing 8% of demand in volume, because cycle service level does not penalise the size of the shortage. Fill rate does, and in practice, fill rate is what customers actually feel.
On-time in-full (OTIF) combines fulfilment volume with the delivery date. An order delivered complete but two days late counts as a miss, even if fill rate registered it as a success. OTIF is the standard service metric in retail and consumer goods, where retailer penalty clauses bite on date as well as quantity.
The Association for Supply Chain Management (formerly APICS) frames service level around the ability to meet customer demand reliably, and warns against reading any single metric in isolation: the useful view is the combination of the three (source: ASCM).
The classic formulas and how to calculate them
The textbook formulas fit on a napkin. The assumptions behind them are where the trouble starts.
Cycle service level is calibrated through the safety stock formula:
safety stock = Z × σD × √LT
Z is the service factor read from a normal distribution table (Z = 1.65 for 95%, Z = 2.05 for 98%, Z = 2.33 for 99%), σD is the standard deviation of daily demand, and LT is the lead time in days. A planner picks a target service level, looks up the Z-score, and sizes safety stock accordingly. It is worth understanding the safety stock formula and the Z-score assumptions behind it before trusting the number it produces.
Fill rate is calculated retrospectively, from actual fulfilment:
fill rate = units shipped on time ÷ units ordered
Take a stock keeping unit (SKU) with average daily demand of 100 units, a demand standard deviation of 30, and a 9-day lead time. At a 95% cycle service level target, safety stock equals 1.65 × 30 × √9 = 149 units. Push the target to 99% and safety stock climbs to 209 units. That 4-point service gain costs 60 extra units of working capital on a single SKU. Multiply by 10,000 SKUs and the trade-off becomes visible on the balance sheet.
Try it yourself!
Set the demand variability and lead time for a single SKU on our interactive safety stock calculator, then drag the target service level and watch the safety stock the formula demands. The number barely moves through the low 90s, then turns almost vertical as you approach 100%. That curve, not the target itself, is the real argument against chasing a flat number across the catalogue.
The formulas hide two assumptions that rarely hold. Demand is rarely normally distributed at SKU level, especially for slow movers, promotional items or intermittent demand. Lead time is rarely deterministic. Stack those assumptions across a full catalogue and the safety stock the formula recommends drifts steadily away from the safety stock the business actually needs.
Why a single service level target across the catalogue is dangerous
Most Supply Chain reviews report one number: "service level was 96.2% last month." Boards like it because it is comparable across quarters. The problem is that the average has almost no operational meaning.
Hidden under a 96.2% headline are SKUs running at 99.8% and SKUs running at 78%. The 78% item might be a critical spare part that halted a production line for three days. The 99.8% item might be a slow-moving commodity holding eight months of cover. Both are bad outcomes. Neither shows up in the headline.
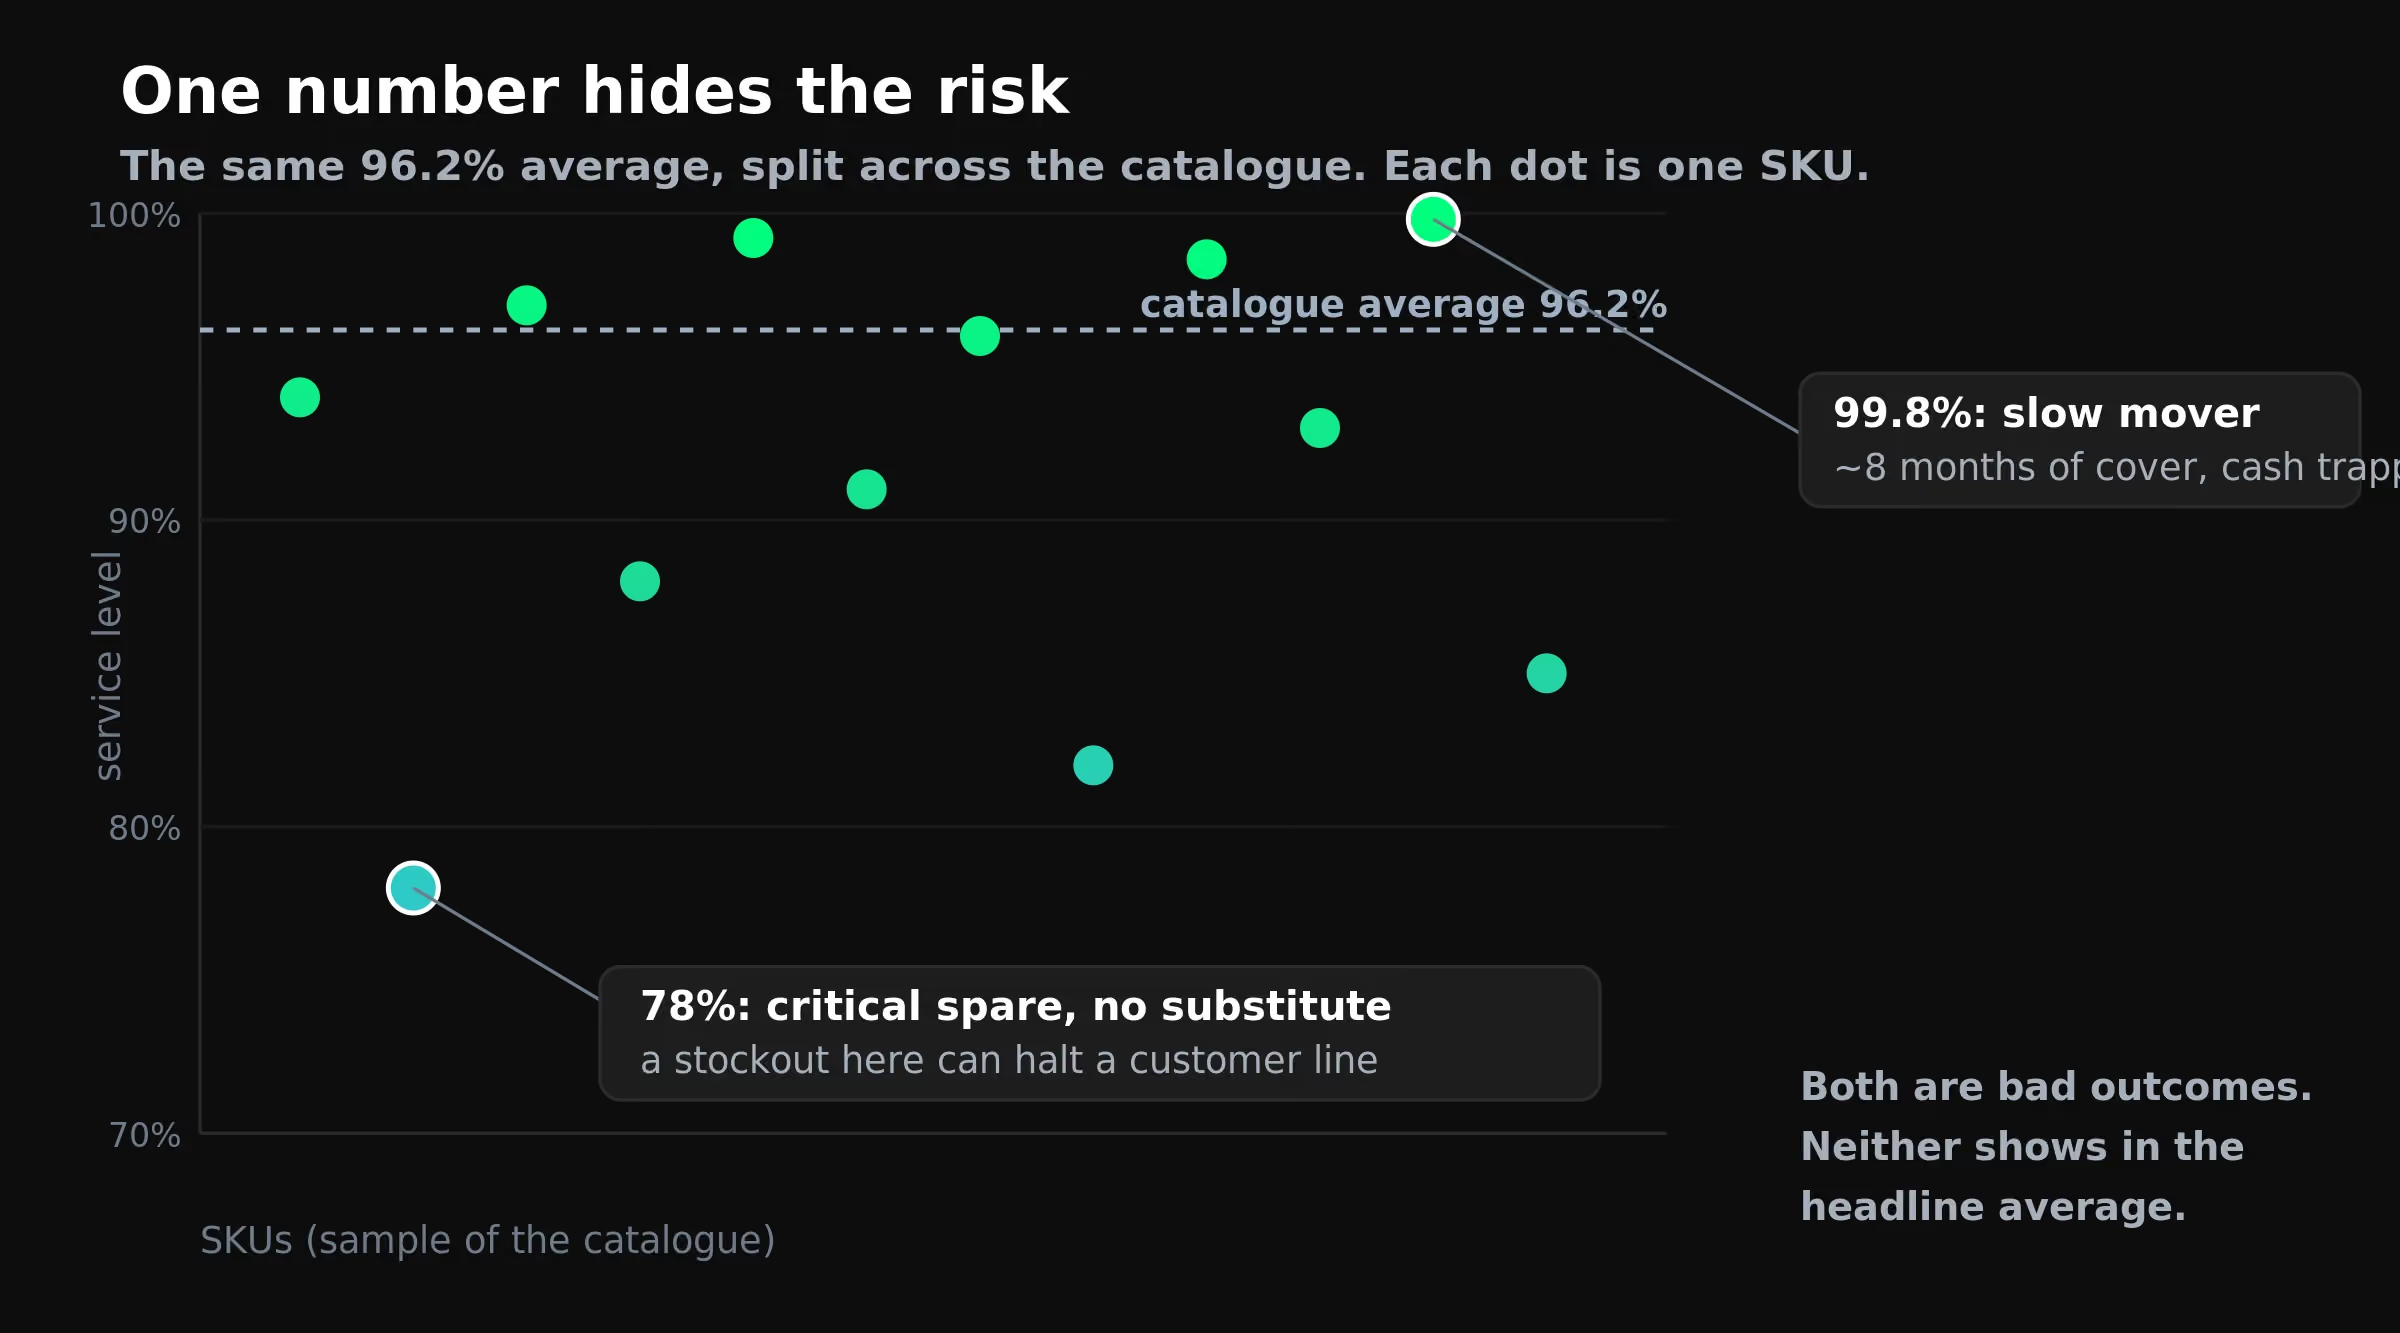
A flat 98% target produces this distortion by design. For a fast-moving, high-margin item with a clean substitute, 98% may be wasteful. For a critical item with no substitute and a six-month lead time, 98% may be catastrophic: that 2% rupture window is exactly when a strategic account loses production.
The decision of where to set the bar is, fundamentally, a political one. It allocates working capital and operational risk across the business. Set it once a year with a consulting firm and the targets calcify against a business that has already moved on. This is the trap that AI-native platforms address by sizing buffers and targets dynamically per SKU rather than annually across the catalogue.
Service level segmentation: margin, criticality and substitutability
The fix is not a better single target. It is a segmented target, recalibrated dynamically. Three dimensions matter more than the rest.
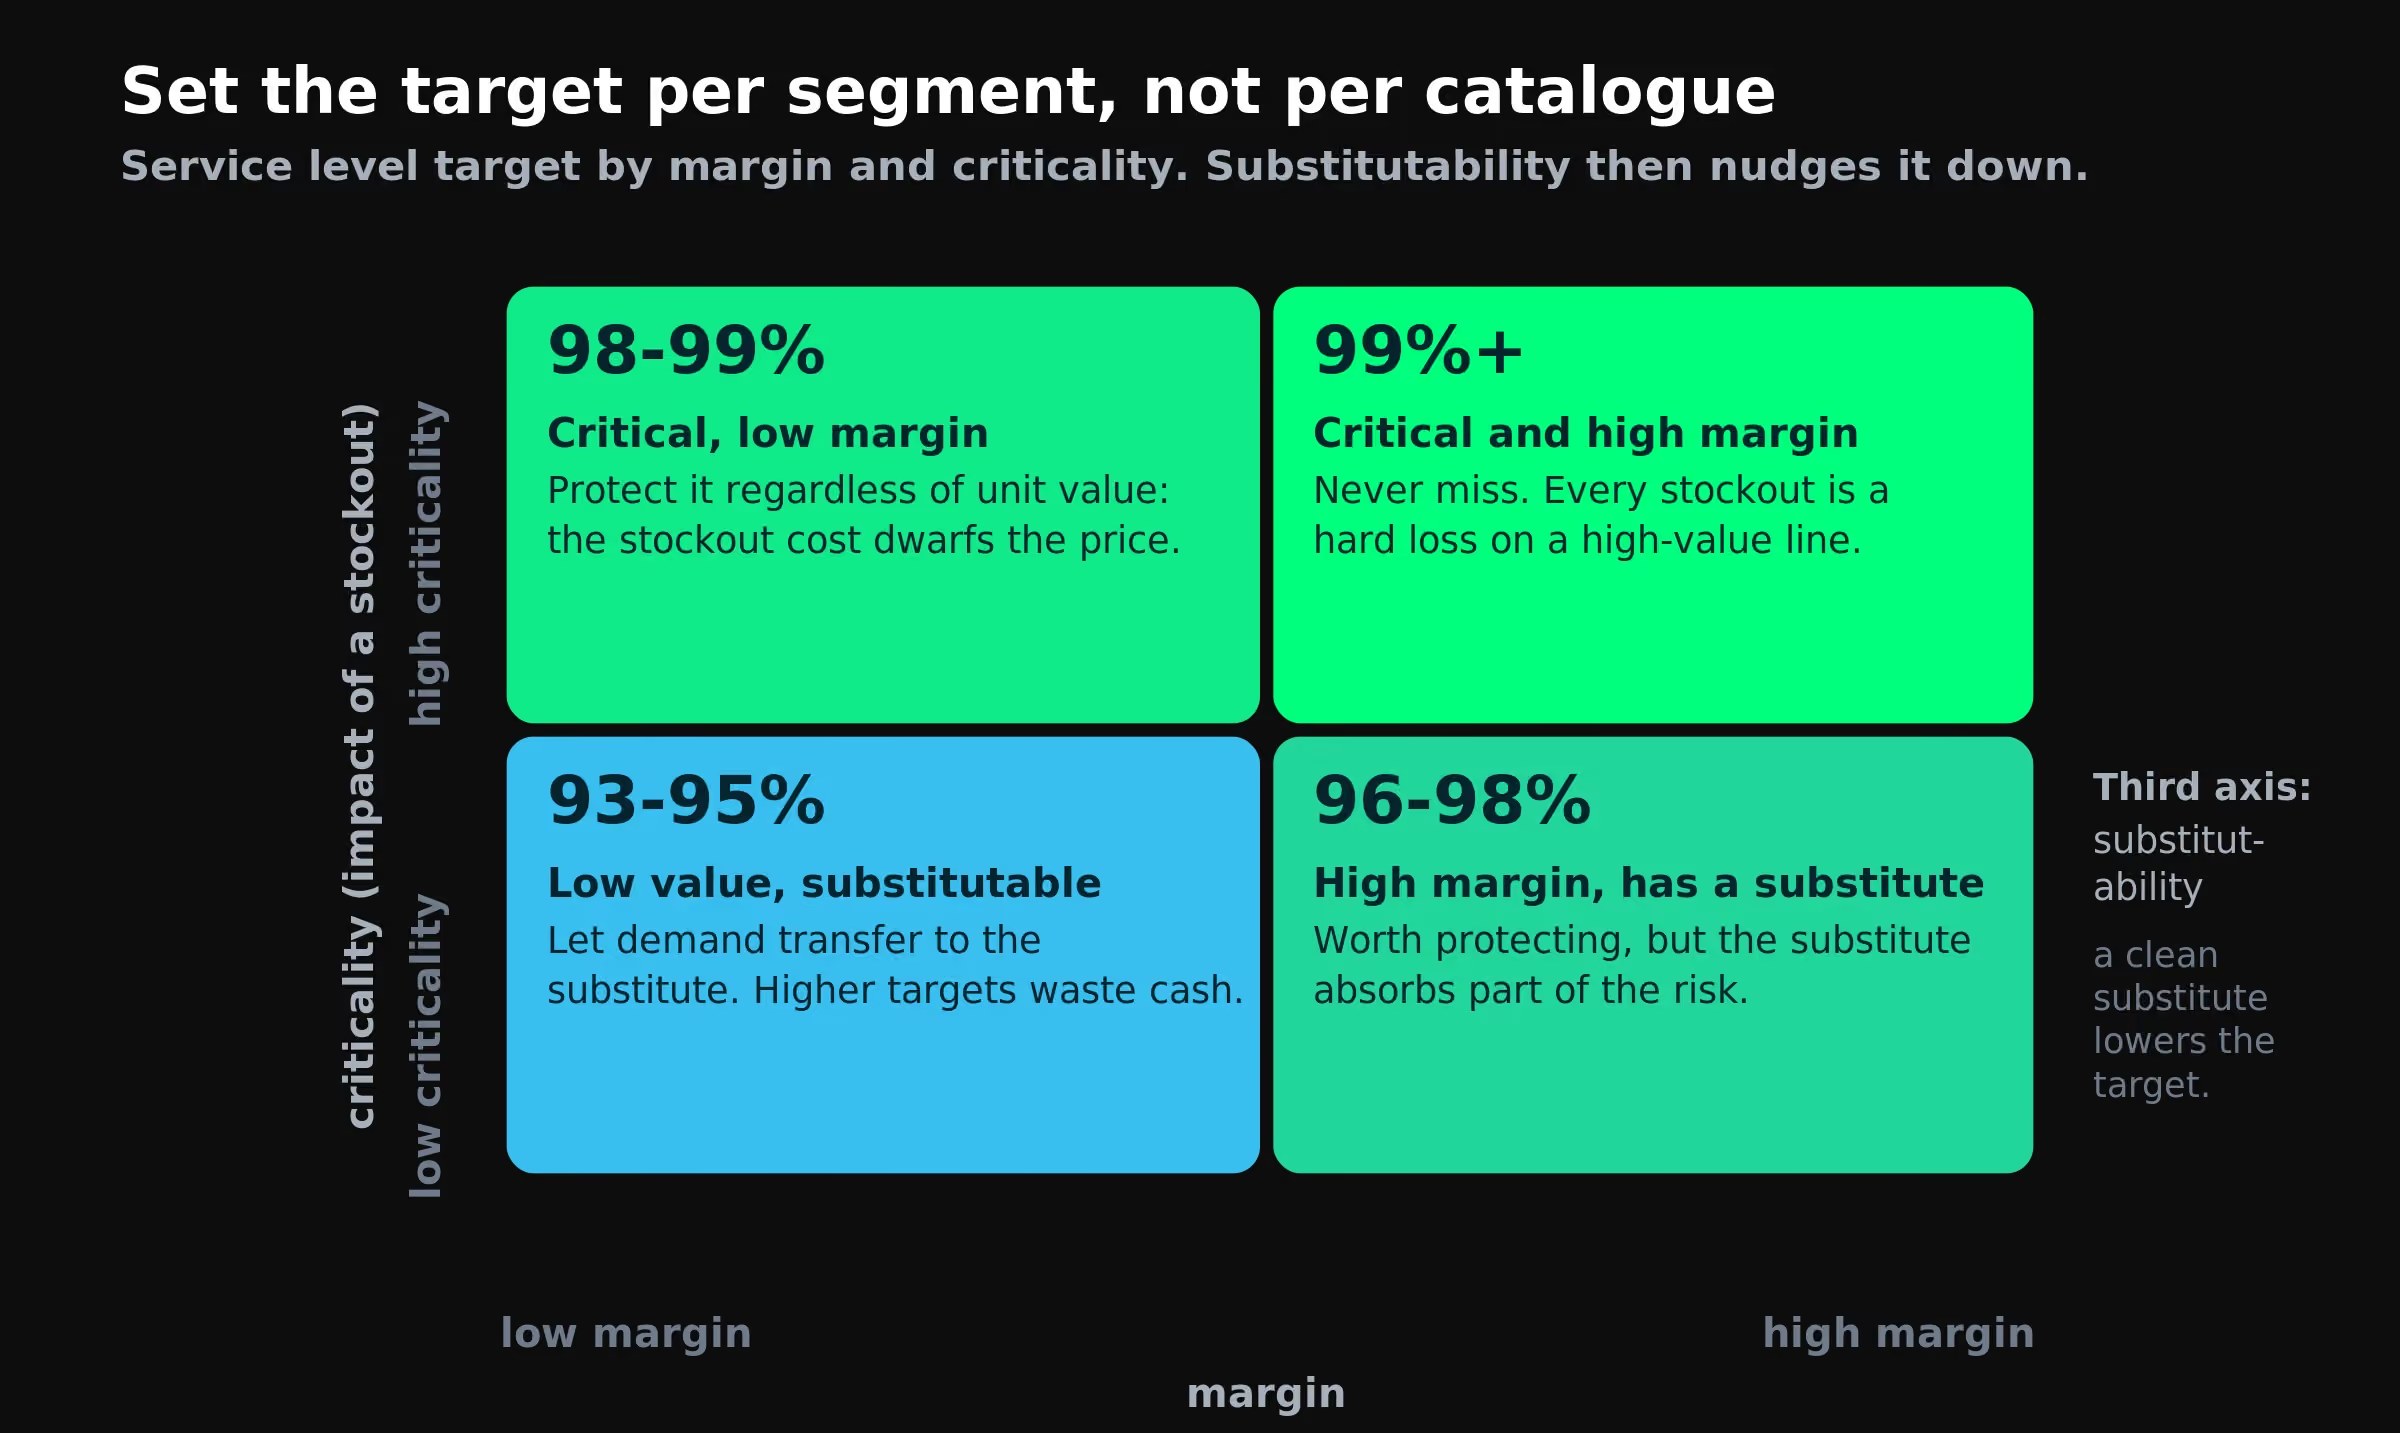
Margin is the easiest to defend in the boardroom. A high-margin item justifies a higher service target because the cost of losing a sale exceeds the cost of holding stock. A low-margin commodity flips the maths: an extra point of service costs more in inventory than the lost margin recovers. Classic ABC (always better control) analysis is a coarse first cut, but ABC alone misses the next two dimensions.
Criticality captures what a stockout does to the customer. A five-euro fastener that immobilises a 500,000-euro machine has a criticality far above its unit value. Critical items deserve service targets in the 99% range regardless of price. Mapping criticality requires a conversation between sales and operations that ABC analysis never forces.
Substitutability is the dimension consulting frameworks usually forget. Two items with identical demand and margin can have radically different service profiles if one has a clean substitute and the other does not. For substitutable items, the target can sit lower because demand transfers seamlessly. For non-substitutable items, every stockout is a hard loss.
Segmented this way, the conversation shifts from "what is our service level?" to "what is the service level for each segment that protects the business outcome we care about?" The segments are not permanent: an item's criticality changes when a customer's strategic value changes, and the targets have to follow.
Improving service level is not about more inventory, it is about better exception decisions
The default reflex when service level slips is to add safety stock. It works mechanically. It also masks the diagnosis, because most service level misses are not caused by under-stocking. They are caused by stocking the wrong items, in the wrong places, at the wrong time.
A planner managing 5,000 SKUs cannot inspect every exception every week. The system surfaces hundreds of alerts. Most are noise. A handful are real: a supplier slipping, a demand pattern breaking, a critical item drifting below cover. The whole job is finding that handful inside the noise.
AI-driven inventory optimization software changes the lever. Flowlity is built on the thesis that more than 95% of a planner's routine work can and should be automated: the algorithm produces a probabilistic demand forecast per SKU, sizes dynamic safety buffers against the uncertainty range rather than a flat Z-score, and surfaces only the exceptions that genuinely need human judgement.
The result, in deployment, is that service level rises while inventory falls, because the two levers stop being traded off blindly. Saint-Gobain Sekurit AGR, a global automotive glazing supplier operating across 30 distribution centres, lifted service level from 95.8% to 97.2%, a gain of 1.4 points, while cutting inventory by 9.25%. The gain came from changing how decisions were prioritised, not from raising buffers across the board.
Service level vs fill rate: when to use which
The two terms are often used interchangeably, and that is part of the problem. They answer different questions.
A 95% cycle service level can coexist with 12% volume loss when the stockouts land on high-velocity SKUs. A mature Supply Chain reports all three metrics at segment level and resists picking a single one for the headline. A team that reports only cycle service level will optimise safety stocks while quietly losing customers on fill rate.
How AI improves service level segmentation in practice
Segmentation is conceptually obvious and operationally hard. A planner managing 10,000 SKUs cannot manually re-tier the catalogue every month. The targets drift, the segments calcify, and within a year the "dynamic" segmentation is back to a flat target dressed up in three colours.
AI changes the economics. AI-driven demand planning turns buffer sizing from a single Z-score lookup into an uncertainty-aware calculation that adapts as demand shifts. Dynamic recalibration refreshes the segmentation continuously instead of annually. Exception prioritisation surfaces the SKUs whose service is actually at risk this week, not a static list from last quarter.
The shift is from a static rule (98% across the catalogue) to a living one (the target on each SKU protects the business outcome attached to it). The forecast distribution feeds the buffer, the inventory engine sizes it, and the planner arbitrates the exceptions. For the mechanics of why probabilistic forecasting reshapes the trade-off, AI in Supply Chain planning goes deeper, and probabilistic demand forecasting explains how a range of outcomes beats a single-point forecast for buffer sizing.
Two sectors, one operating model: service level in practice
The same operating model shows up across very different demand profiles.
In industrial automotive supply, the Saint-Gobain Sekurit AGR deployment described above moved service up 1.4 points while inventory came down 9.25%, driven by better exception decisions rather than higher buffers. Product availability is decisive in that market: if the item is not on the shelf at the local distribution centre, the customer calls a competitor.
At the other end of the spectrum sits multi-category retail. A large home improvement and building-materials retailer with high demand volatility faces the opposite pressure: promotional cycles, seasonality and competitor moves shift demand inside a single quarter, so any segmentation that does not refresh constantly falls behind. After deploying probabilistic forecasting and dynamic buffers, this retailer gained several points of service level through the same mechanism: the planner stopped reacting to every alert and started arbitrating the ones that mattered.
Two sectors, two service profiles, one shared operating model. For the wider picture, the Flowlity guide on building a mature and synchronized Supply Chain planning model walks through how service metrics, inventory targets and S&OP cadence reinforce each other.
Reading service level the way a planner should
Service level is not one number. It is a portfolio of decisions about where to spend working capital and where to absorb operational risk. A monthly 96.2% headline tells a board the average. It tells a planner almost nothing about whether the right SKUs are protected, whether the wrong SKUs are over-buffered, and whether the trend is moving towards or away from the outcomes that matter.
The mature reading is segmented, dynamic and exception-driven. Segmented across margin, criticality and substitutability. Dynamic, so the segmentation refreshes as the business changes. Exception-driven, so the planner spends time on the issues that actually move service.
See how Flowlity replaces static safety stock targets with living buffers that protect service where it matters, without inflating inventory where it does not. Book a demo.
Level up your supply chain with AI.
Get a demo


FAQ
Find everything you need to know right here.
How do you calculate service level in Supply Chain?

Cycle service level is calibrated through the safety stock formula: safety stock = Z × σD × √LT, where Z is the service factor (1.65 for 95%, 2.05 for 98%), σD is the standard deviation of daily demand and LT is the lead time. Fill rate is calculated retrospectively as units shipped on time divided by units ordered. The formula gives you a target, but whether the business actually hits it depends on demand normality and lead time stability, and neither assumption holds cleanly across a full catalogue.
What is the service level in Supply Chain?
Service level is the family of metrics that measures how reliably a Supply Chain meets customer demand. The three most common variants are cycle service level (the probability of no stockout during a replenishment cycle), fill rate (the proportion of demand fulfilled directly from stock) and on-time in-full (OTIF, the share of orders delivered complete and on the agreed date). A mature reporting view uses all three at segment level rather than a single headline number, because each one hides a different failure mode when read alone.
What is the difference between service level and fill rate?
Cycle service level measures the probability of avoiding a stockout during a replenishment cycle, and it drives safety stock sizing. Fill rate measures the volume of demand actually fulfilled, in units, lines or orders. A planner can hit a 95% cycle service level while losing 8% of demand in volume, because cycle service level does not penalise the size of the shortage. Use cycle service level for safety stock work and SKU risk profiling, and use fill rate for customer-facing commitments and scorecards.
Is 98% a good service level target?
It depends entirely on the SKU. For a critical, non-substitutable spare part with high customer impact, 98% may be too low, with 99.5% closer to the right answer. For a low-margin commodity with clean substitutes, 98% is often wasteful, and 93% to 95% can deliver the same customer experience at a fraction of the inventory cost. A flat 98% target across the whole catalogue produces an average that hides both failure modes at once, which is why segmentation by margin, criticality and substitutability matters more than the headline figure.
How can AI improve service level without adding stock?
AI shifts the lever from more stock to better exception decisions. Probabilistic forecasting sizes buffers against the actual demand uncertainty range per SKU rather than a flat Z-score. Dynamic segmentation refreshes the target by margin, criticality and substitutability instead of freezing it once a year. Exception prioritisation surfaces the alerts that genuinely threaten service, so the planner spends time where it changes the outcome. The net effect in deployment is service rising while inventory falls, because the two are no longer traded off blindly.