.svg)
.svg)

Two things have been true simultaneously for two decades: inventories have grown and shortages have multiplied. More buffer, worse outcomes. The contradiction is not accidental. It is the direct consequence of planning models that respond to uncertainty by adding stock everywhere rather than sizing it precisely where risk is highest. Predictive analytics in Supply Chain planning is the mechanism that resolves this contradiction.
What is predictive analytics in Supply Chain planning?
Predictive analytics in Supply Chain planning is the use of historical data, real-time signals, statistical models, and artificial intelligence to anticipate future demand, supply variability, and disruption risk before they materialize. It does not try to predict the future with precision. It establishes the probability distribution of possible outcomes and uses that distribution to size buffers, set replenishment parameters, and prioritize planner attention.
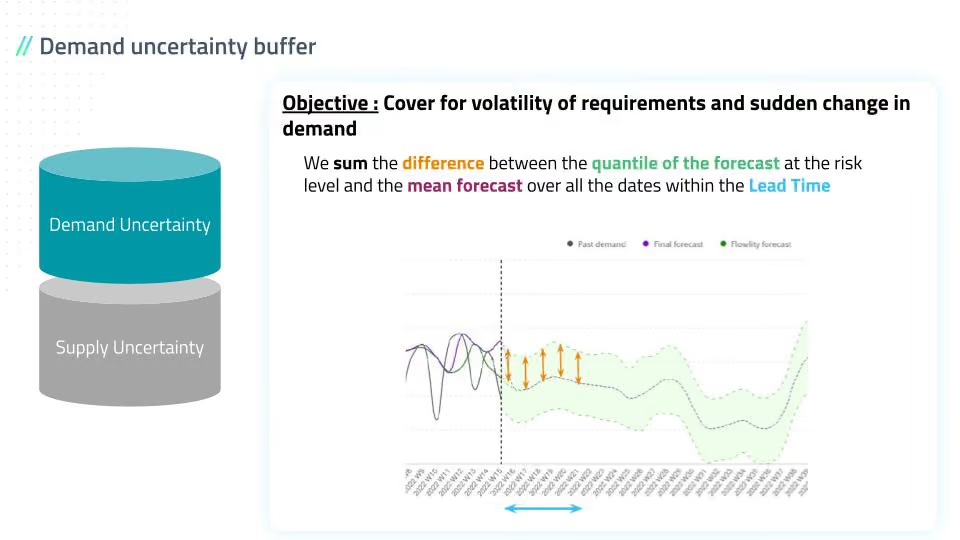
The distinction from traditional forecasting is fundamental. A traditional forecast produces one number: expected demand next month. Predictive analytics produces a range of outcomes, each with an assigned probability. A planner using a single-point forecast sets safety stock based on an average. A planner using probabilistic forecasting sets safety stock based on the actual shape of uncertainty for that SKU in that period, which is a materially different calculation.
This is what makes predictive analytics the right tool for modern Supply Chains. Demand volatility, supplier variability, geopolitical disruptions, and climate-related logistics delays do not produce average outcomes. They produce distributions with fat tails. Managing those tails requires knowing they exist.
Watch the following webinar for a technical masterclass on how AI and probabilistic models generate demand scenarios and confidence intervals in practice.
Why do traditional safety stock models fail?
Safety stock is the buffer quantity held to absorb unexpected demand spikes or supplier delays. It is calculated based on two core inputs: expected demand (the quantity of products that will be consumed or purchased) and replenishment time (the time between placing an order and receiving it). The level is then calibrated according to four criteria:
- the relative importance of storage costs versus opportunity costs (the cost of not selling)
- the level of risk the organization is willing to accept
- the desired service level
- the activity profile of the product
On paper, this calculation is straightforward. In practice, most companies review it once a year. That annual review cycle is the source of the problem.
Why static parameters produce dynamic failures
Both input factors, demand and replenishment time, are variables, not constants. Demand fluctuates by season, promotion, channel, and market condition. Lead times vary by supplier, region, and logistics environment. Setting safety stock based on averages of these variables and then leaving those averages unchanged for twelve months guarantees a mismatch between the buffer and the actual risk it is supposed to cover.
The traditional MRP approach compounds this problem. Material requirements planning (MRP) calculates replenishment needs by taking downstream demand forecasts and propagating them through the bill of materials using deterministic logic. Each calculation step treats variables as constants, locking parameters into the plan. The recommendations these calculations produce are often satisfactory immediately after implementation but degrade quickly as market conditions shift. The parameters become stale. The volatility the model was designed to absorb instead gets amplified upstream, creating the internal bullwhip effect that produces simultaneous overstocking and shortages across the same network.
Multiple sources of variability compound this: demand variability, production plan changes, breakdowns, scrap rates, and quality issues all affect MRP reliability in ways the model cannot self-correct for.
How does a flow-based approach change safety stock logic?
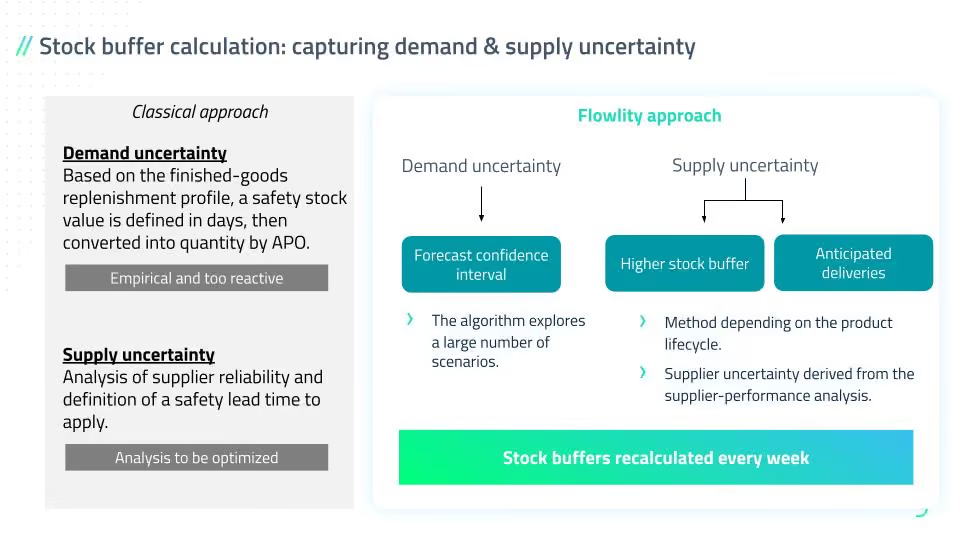
The flow-based approach is the alternative to deterministic MRP for safety stock management. Instead of calculating net requirements by exploding finished goods forecasts through the bill of materials, it sets up decoupling buffer stocks at strategic points in the Supply Chain and dynamically adjusts those buffers by forecasting consumption requirements directly.
The key difference is what the system is trying to predict. Traditional MRP tries to predict what quantity will be consumed. A flow-based approach asks a different question: what is the probability distribution of consumption, and how much buffer do we need to cover that distribution at the desired service level?
Through AI-driven forecasting algorithms, the system forecasts lead times based on what actually happened rather than contractual commitments, which are frequently different from reality. By continuously re-evaluating lead time and demand variables automatically, the gap between forecast and reality narrows over time rather than drifting further apart.
How does this differ from DDMRP?
Demand-Driven MRP (DDMRP) introduced the right principles: buffer positioning at decoupling points, consumption monitoring, and order replenishment logic. These are fundamentally correct for inventory optimization. Two structural limitations remain, however.
First, DDMRP relies on static settings for volatility and lead time coefficients. These parameters need empirical updating based on ground-level knowledge of what is happening in the supply base. The question is how to ensure those settings remain correct when volumes are changing quickly across thousands of SKUs simultaneously. Manual updating does not scale.
Second, DDMRP optimizes inventory at the level of an individual company without accounting for extended Supply Chain dynamics. It does not address the bullwhip effect across the full network of suppliers and customers. A company optimizing its own buffers in isolation while its upstream and downstream partners operate with different logic still absorbs amplified variability from adjacent nodes.
By taking the DDMRP principles as a foundation but dynamically adjusting minimum and maximum stock recommendations through AI and continuously improving forecasts, it is possible to achieve greater inventory reduction than DDMRP delivers for the same service level. The gains compound further when other links in the Supply Chain are included through collaborative planning.
What makes predictive analytics different from deterministic forecasting?
The practical difference comes down to how uncertainty is represented and acted upon.
The last row matters more than it might appear. AI-driven predictive analytics trains across the full product portfolio simultaneously, allowing the algorithms to detect correlations that per-product models cannot capture. If sales of garden tables increase, this almost certainly affects demand for garden chairs. A forecasting model built per product can only establish this correlation manually. A model trained across all products detects it automatically and adjusts safety stock for both references accordingly. At the scale of thousands of SKUs, this cross-product intelligence is not a marginal improvement. It is a structural capability that per-product deterministic models cannot replicate.
How does predictive analytics apply to disruption anticipation?
One of the most operationally valuable applications of predictive analytics in Supply Chain planning is early disruption detection. According to CDP's Transparency to Transformation report, over 8,000 suppliers reported $1.26 trillion of revenue at risk from environmental risks including climate change, deforestation, and water insecurity, with $120 billion in direct cost increases expected to cascade to corporate buyers within five years. Climate-related disruptions, including hurricanes, floods, and extreme weather events, are increasing in both frequency and severity. Waiting for disruptions to materialize before responding is not a viable planning posture.
Predictive analytics enables a different posture. By continuously monitoring demand signals, supplier performance data, and external indicators, the system detects patterns that precede disruptions before the disruption itself becomes visible in operational data. Specific signals the system tracks include:
- unusual demand spikes or drops relative to the forecast probability distribution
- deteriorating supplier delivery reliability versus historical performance
- lead time extensions beyond the forecasted range
- inventory positions trending toward shortage risk based on current consumption rate and projected replenishment timing
These signals surface as prioritized alerts, ranked by financial and service impact, so planners can act on the highest-risk situations first rather than reviewing every SKU manually. The Supply Planning layer translates these alerts into specific replenishment recommendations, closing the loop between prediction and action.
What results does predictive analytics deliver in practice?
The business case for predictive analytics in Supply Chain planning rests on the same counter-intuitive result that probabilistic inventory optimization consistently produces: lower inventory and better service levels simultaneously.
Traditional planning treats these as a trade-off. More buffer means better protection, less buffer means more risk. Predictive analytics rejects that trade-off by sizing each buffer to the actual risk profile of that SKU in that period. Stable, short-lead-time references carry less because the data justifies it. Volatile or critical references carry more, but only where the probability distribution warrants it.
Saint-Gobain improved forecast accuracy by 15% at SKU level and increased service levels across their distribution network after implementing AI-driven Supply Chain planning. Magotteaux reduced stockouts by 8% and cut inventory levels by 13% in parallel. Both outcomes reflect the same underlying mechanism: buffers sized to actual risk rather than static coverage rules.
What does it take to succeed with predictive analytics in Supply Chain?
Predictive analytics is not a technology project that delivers results on installation. It is a capability that compounds as data quality improves, model accuracy increases, and organizational trust in the outputs grows. The key conditions for success are:
- Data quality and accessibility: predictive models inherit the inconsistencies of their inputs. Cleaning sales history, lead time records, and master data before model deployment delivers more impact than algorithm tuning.
- Integration with existing ERP and planning systems: predictive insights have no operational value if they cannot be acted on inside the existing planning workflow. ERP integration is the prerequisite for closing the loop between forecast and replenishment order.
- Exception-based governance: the highest-return operating model is one where AI handles routine recalibration automatically and planners concentrate on the exceptions flagged as requiring judgment.
- Progressive scope expansion: the most successful deployments start with demand forecasting and dynamic safety stock for the highest-volume, most critical SKUs, validate results, and then expand scope progressively. This phased approach also reduces the initial investment: plug-and-play solutions such as Flowlity Lite enable companies to start with a focused scope, validate business impact quickly, and scale progressively as confidence grows.
The organizations that treat predictive analytics as a platform capability rather than a point solution extract the most value from it. Each new data source, each new product category brought into scope, and each model improvement compounds across the full portfolio.
Why predictive analytics is now the baseline for competitive Supply Chain planning
Despite significant ERP and planning system investment over two decades, the fundamental tension between excess inventory and shortages has not resolved. The reason is not that companies failed to invest. It is that the model they invested in, deterministic MRP with static safety stock, is architecturally incapable of responding to volatility without generating either excess inventory or shortages. Predictive analytics is not an upgrade to that model. It is a replacement of the underlying logic.
The companies that have made this shift are not managing Supply Chain risk better because they have more data. They are managing it better because they are using data differently, to quantify the shape of uncertainty rather than to average it away. That difference in approach is what separates a Supply Chain that compounds inventory reduction and service level improvement over time from one that perpetually trades one for the other.
Discover how Flowlity's inventory optimization platform uses predictive analytics to replace static safety stocks with dynamic, AI-driven buffers sized to actual risk.
Level up your supply chain with AI.
Get a demo

FAQ
Find everything you need to know right here.
What is safety stock? How is it calculated?

Safety stock is a buffer quantity kept on hand to absorb unexpected demand spikes or supplier delays. It is typically calculated using the desired service level, demand variability, lead time variability, and average consumption. The goal is to maintain product availability without holding excessive inventory, striking a balance between service and cost.
Classic formulas assume demand follows a normal distribution and lead times stay constant — assumptions that rarely hold in volatile markets. Dynamic safety stock models use probabilistic forecasting to recalculate buffers item-by-item as demand patterns and supplier performance shift, preventing stockouts during peaks while avoiding excess stock during quieter periods.
What are predictive analytics in supply chain management?
Predictive analytics in Supply Chain management uses historical data, real-time signals, and advanced models to anticipate future demand, risks, and disruptions. It focuses on probabilities rather than single-point forecasts. The probabilistic framing matters because Supply Chain decisions, safety stock, replenishment, capacity, are inherently decisions under uncertainty. A single-point forecast gives an answer but hides the risk around it, while a probabilistic forecast exposes the full distribution and lets planners size buffers to the actual variability per SKU period. The result is better service level at lower inventory cost, with decisions that adapt continuously as new data arrives rather than only at fixed planning cycles.
Why predictive analytics is essential for supply chain success?
Because modern Supply Chains are highly volatile, predictive analytics helps organizations anticipate uncertainty, reduce firefighting, and make better inventory and planning decisions before problems occur. Without an anticipatory layer, teams spend most of their time reacting to issues that were already visible in the data days or weeks earlier, with fewer options and higher response costs. Predictive analytics closes that gap by translating raw signals, demand drift, lead time variability, supplier behavior, into actionable forecasts and risk alerts. The cumulative effect on KPIs is significant: more stable service level, lower safety stock, and noticeably less expediting cost across the planning cycle.
What are the use cases of predictive analytics in supply chain?
Common use cases include demand forecasting, safety stock optimization, supplier risk management, logistics planning, and predictive disruption alerts. The value compounds when these use cases share the same underlying probabilistic model rather than running in isolation. A consistent view of demand uncertainty and lead time risk feeds safety stock sizing, replenishment proposals and supplier prioritization at the same time, which keeps decisions aligned across functions. In practice, the highest-return entry point is usually demand forecasting combined with dynamic safety stock, since those two together unlock most of the service level improvement and working capital reduction that justify the investment in the first place.
What is meant by predictive analytics?
Predictive analytics refers to techniques that analyze data to estimate what is likely to happen in the future, often using statistical models and machine learning. In Supply Chain, the most useful version of predictive analytics goes beyond a single point estimate and provides a full distribution of likely outcomes per SKU and period. That probabilistic view supports better decisions on safety stock, replenishment and capacity because the planner can see the risk around the forecast, not just its central value. The methodology matters because Supply Chain decisions are inherently decisions under uncertainty, and ignoring that uncertainty is what produces both stockouts and excess inventory.
How predictive analytics improves supply chain risk management?
It identifies early signals of risk: such as demand volatility or supplier instability, allowing teams to act before disruptions impact service or costs. Predictive analytics shifts Supply Chain risk management from reactive to anticipatory by quantifying probabilities rather than waiting for confirmation. Patterns in lead time variability, demand drift or supplier performance become visible while there is still time to rebalance stock, escalate orders or adjust commitments. The earlier the signal, the cheaper the response, which is why predictive analytics consistently shows up among the highest-return investments in volatile Supply Chains, particularly where shortages on critical components are expensive to recover from.
What are the challenges of predictive analytics in supply chain?
Key challenges include data quality, integration with legacy systems, organizational resistance, and over-reliance on tools without proper governance. Of these, data quality is usually the most binding constraint: models inherit the inconsistencies of their inputs, so cleaning master data, sales history and lead times often delivers more impact than tuning algorithms. Integration matters next, because predictive insights have no operational value if they cannot be acted on inside the existing planning processes. Governance closes the loop by defining who owns model outputs, how exceptions are handled, and how performance is reviewed, which is what turns predictive analytics from a one-off project into a sustained capability.
What is the future role of predictive analytics in supply chain management?
Predictive analytics will increasingly support autonomous planning, real-time decision-making, and scenario-based simulations, becoming a core capability for resilient Supply Chains. The direction of travel is toward planning systems that not only forecast outcomes but also recommend, and in some cases execute, the decisions that follow. As models mature and data quality improves, the share of routine decisions handled automatically grows, while planner time concentrates on exceptions and strategic trade-offs. The KPIs that benefit most are service level stability under volatility and the speed at which the operation can absorb a disruption, both of which depend more on decision latency than on average forecast accuracy alone.