.svg)
Interactive Supply Chain Tools
Explore Flowlity's collection of free interactive Supply Chain tools: hands-on calculators and simulators for safety stock, reorder points, DDMRP buffers and the bullwhip effect. Each one lets you move the inputs and see the result update instantly, so you can build intuition around the maths behind inventory optimization and demand planning. They are illustrative, textbook models made for learning, not Flowlity outputs.

Frequently Asked Questions About Supply Chain Calculators & Tools
What is a Supply Chain calculator?

A Supply Chain calculator is a simple tool that applies a textbook planning formula to your inputs, so you can see how one decision changes an outcome. Classic examples include a safety stock calculator, a reorder point calculator, or a DDMRP buffer builder: you enter demand, lead time, variability and a target service level, and the tool returns the buffer or trigger the formula produces.
These calculators are great for learning and quick estimates, but they assume demand behaves in a simple, stable way. Real Supply Chains rarely do, which is why teams eventually move from static formulas to AI-driven inventory optimization.
What can you calculate with Flowlity's free Supply Chain tools?
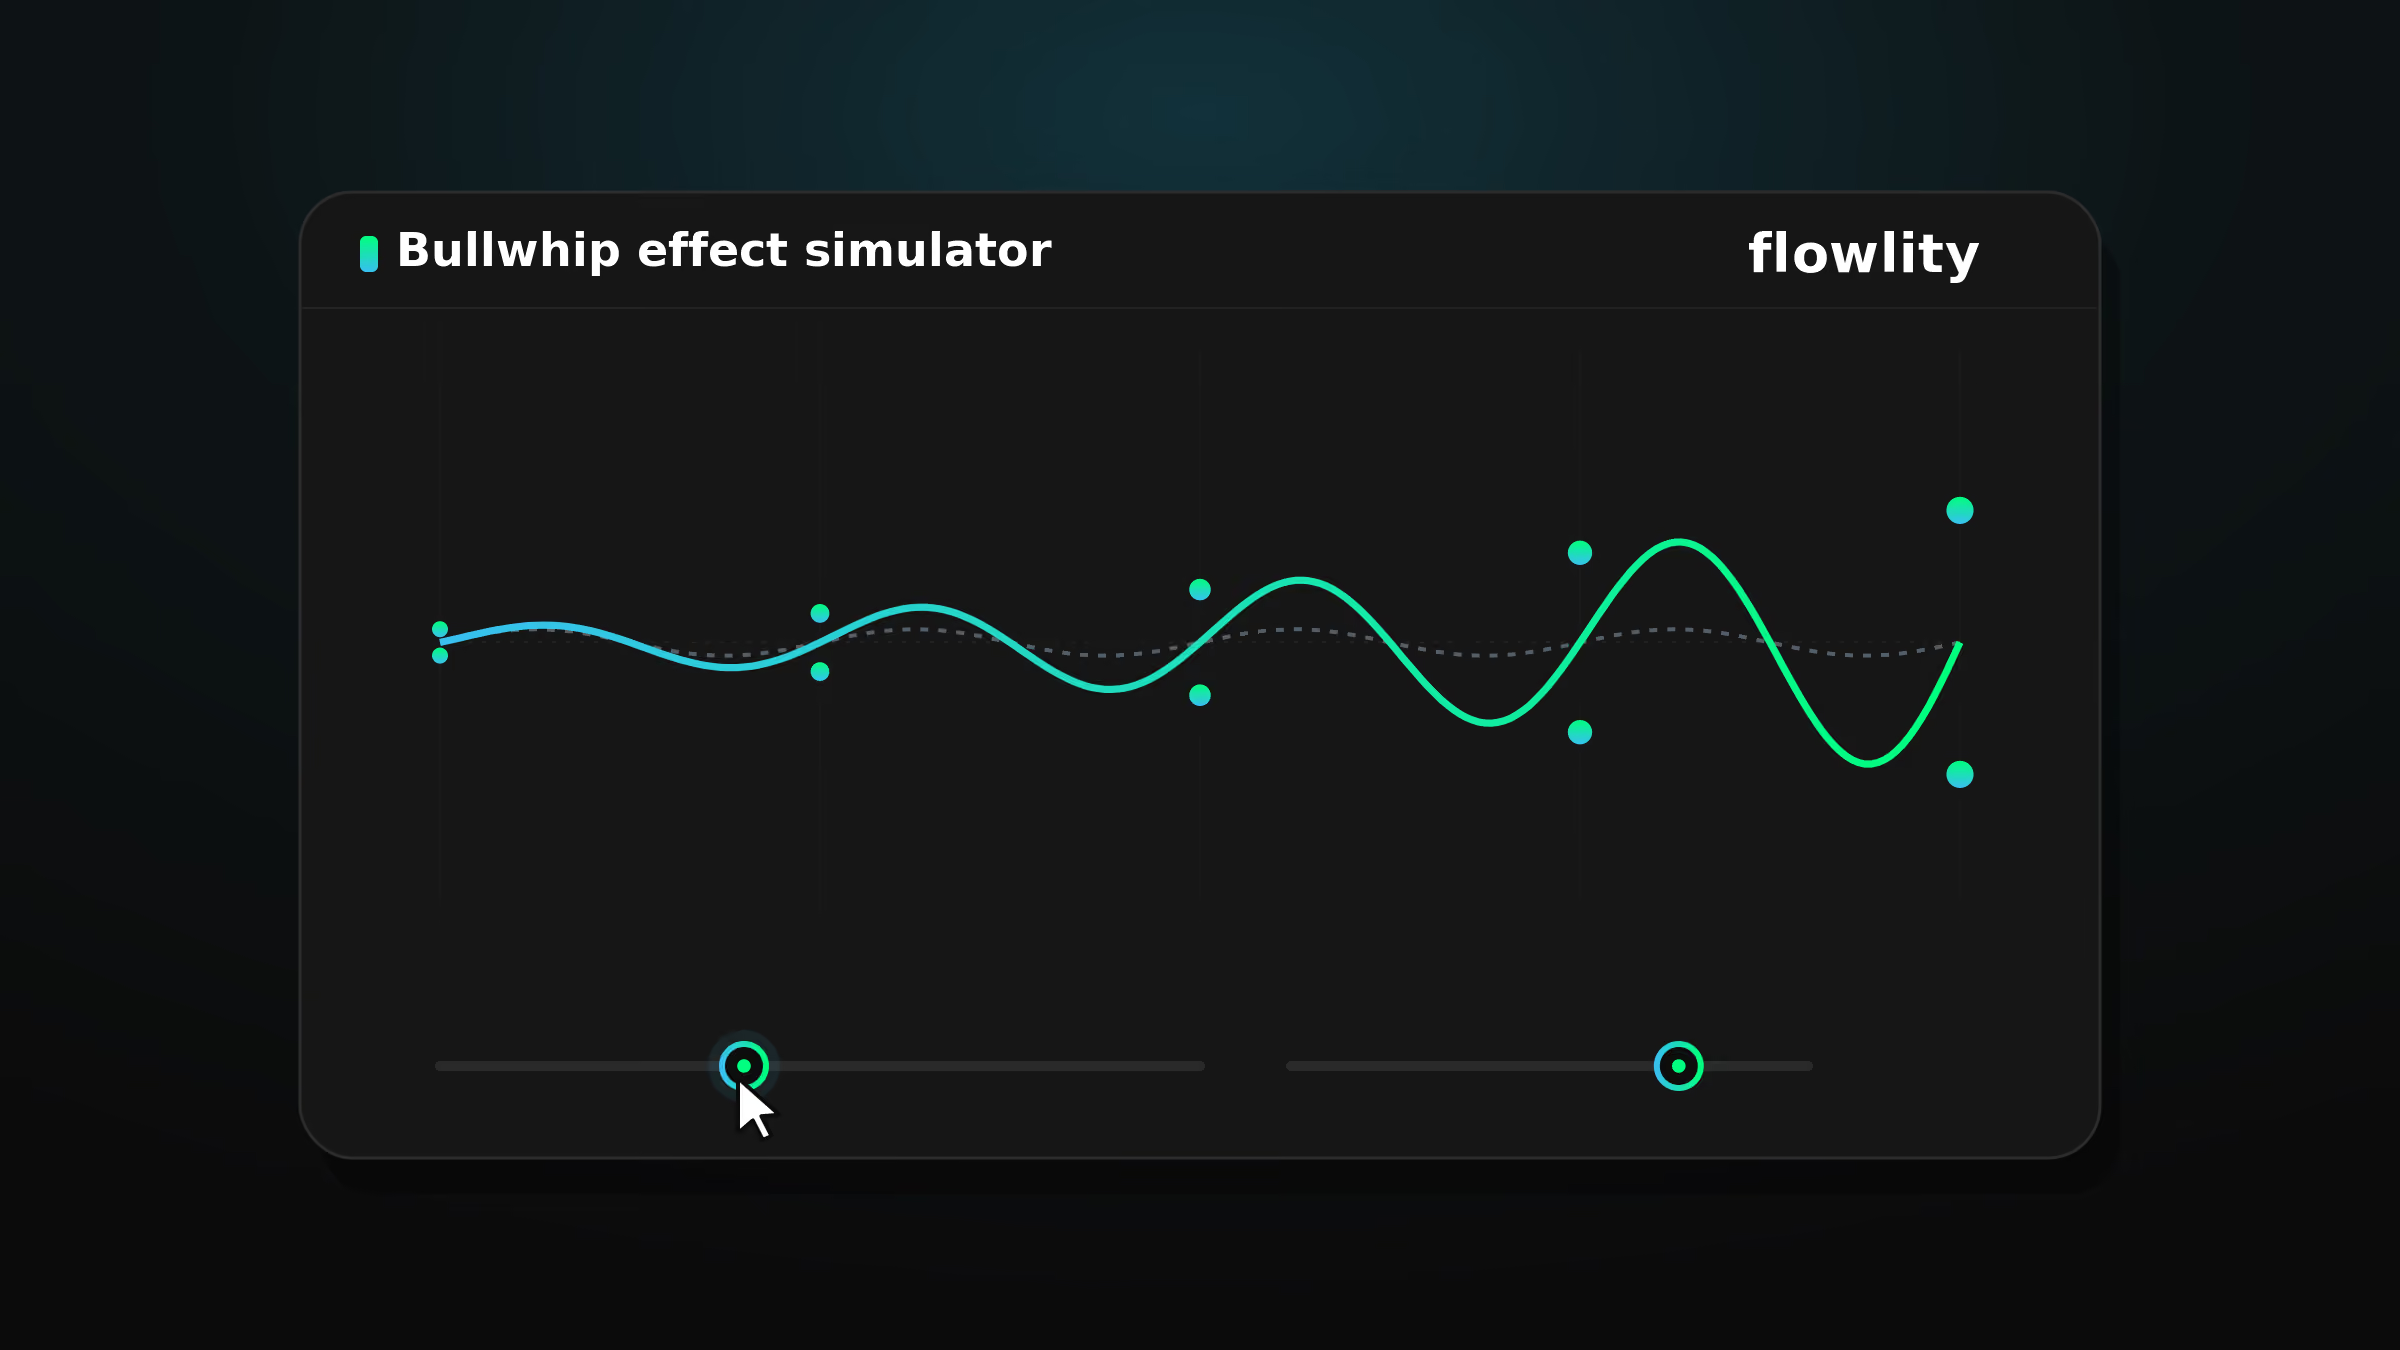
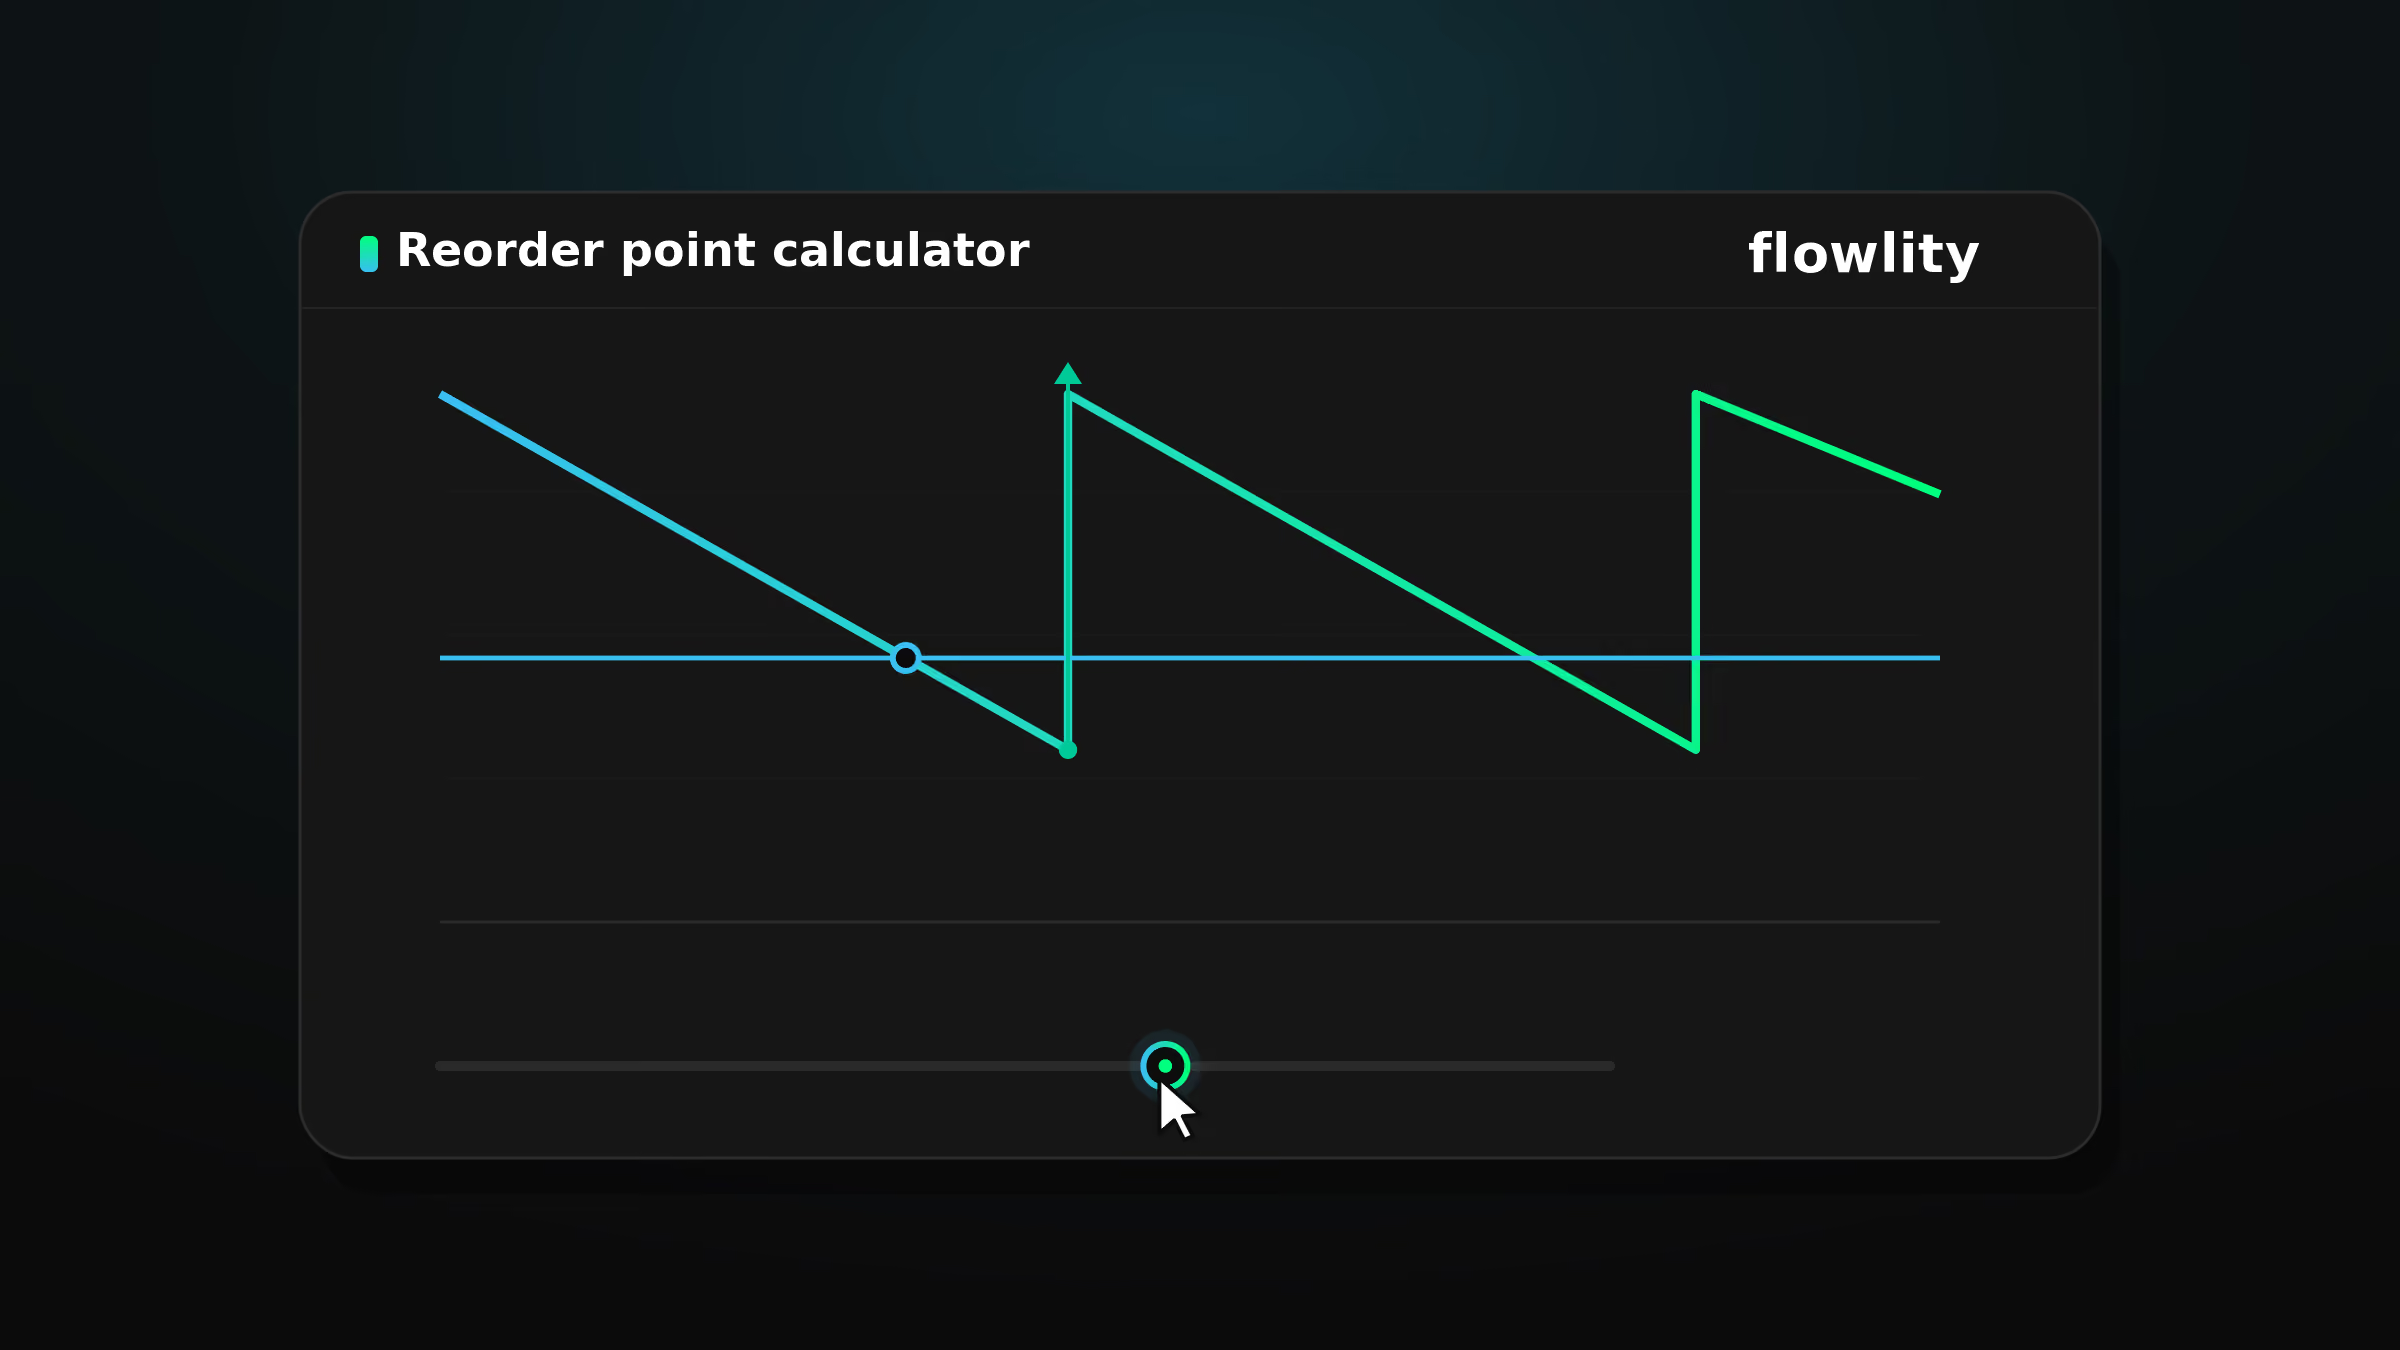
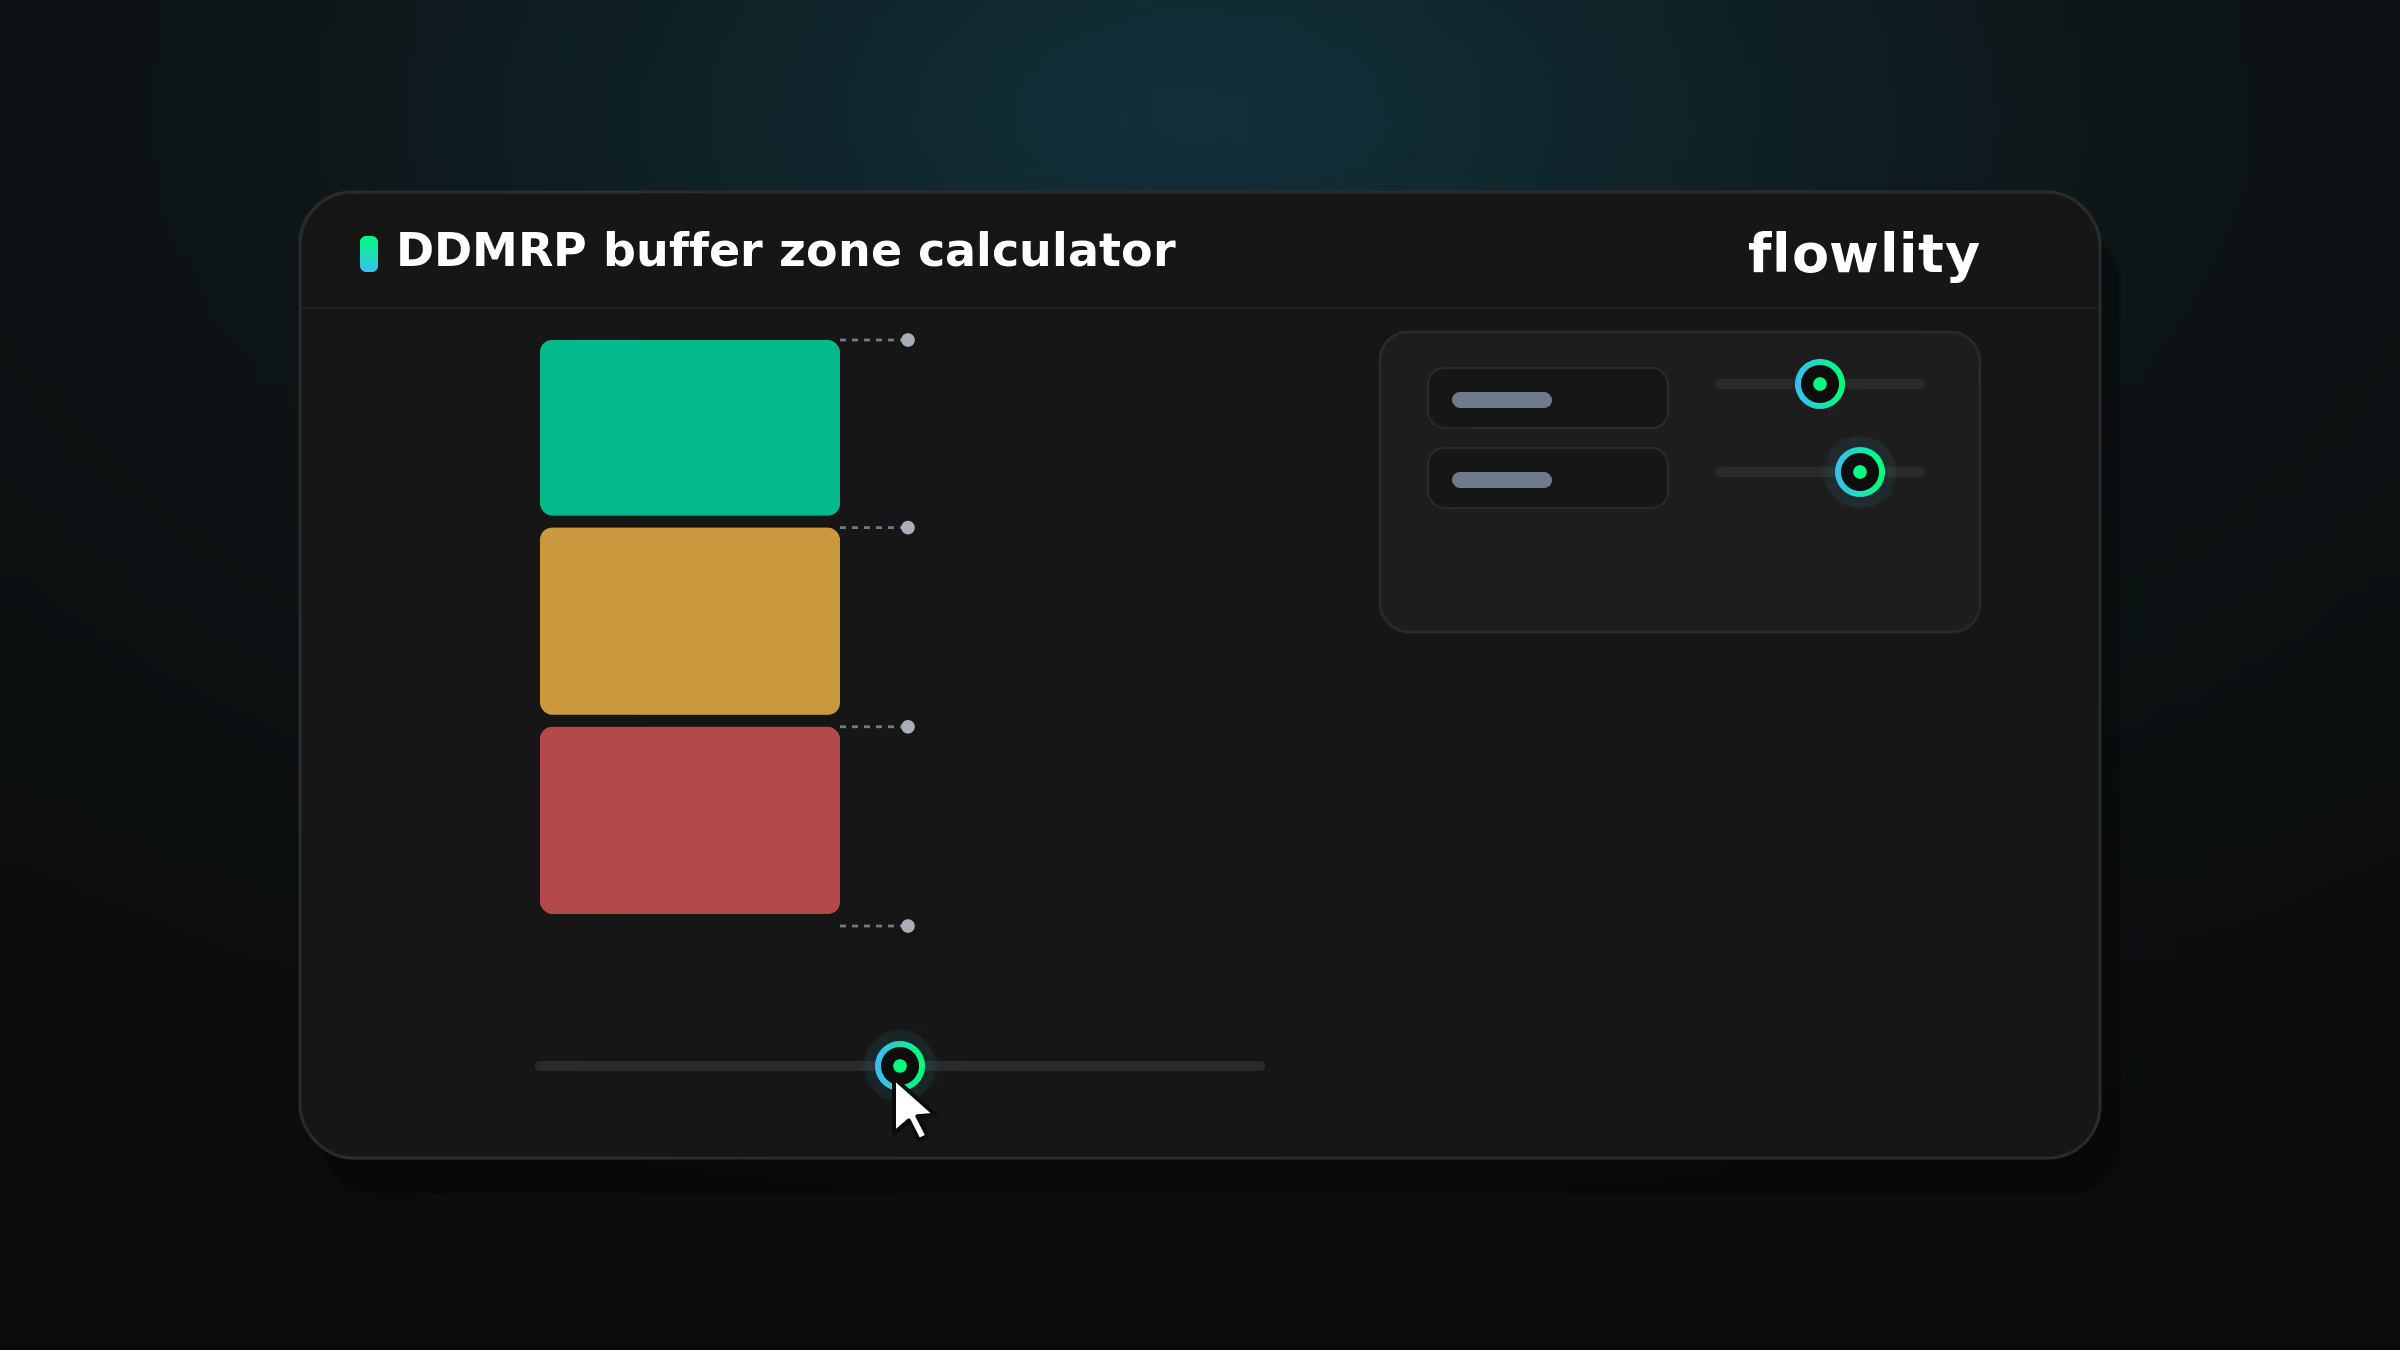
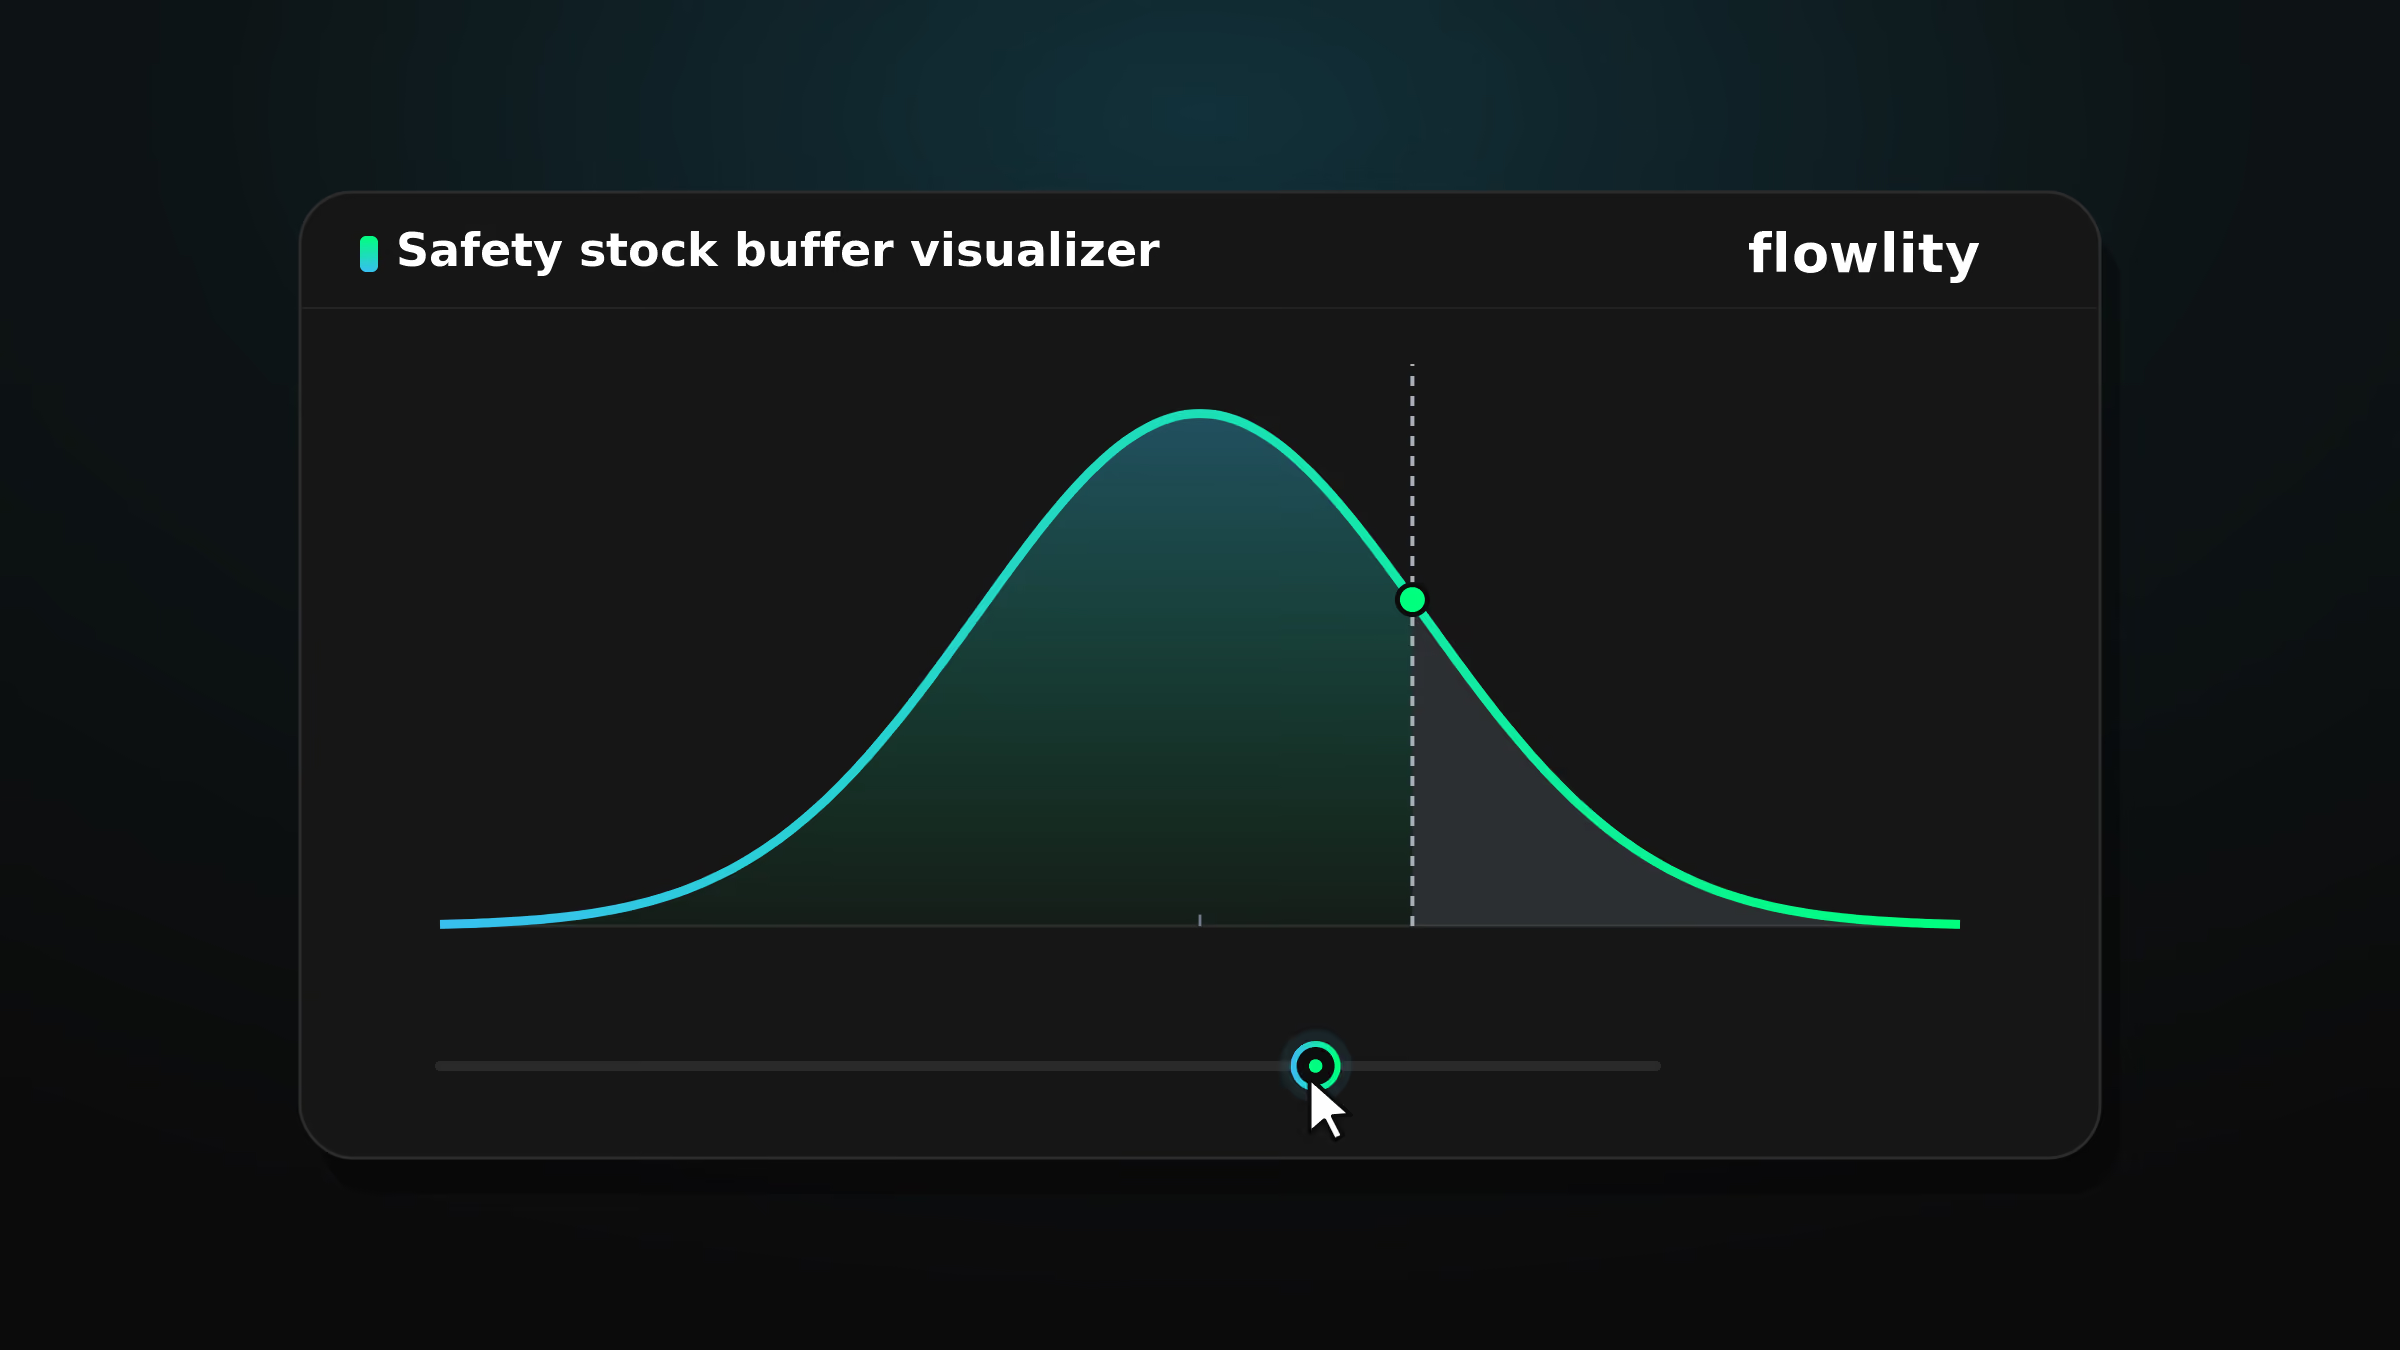
Flowlity's free interactive tools cover the calculations Supply Chain teams reach for most often. You can size a buffer with the safety stock calculator, see how service level trades off against risk in the safety stock buffer visualizer, build red, yellow and green zones with the DDMRP buffer calculator, find your reorder point, and watch demand variability amplify upstream in the bullwhip effect simulator.
Each tool is interactive: move the sliders and the chart and results update instantly, so you can build intuition around demand planning and inventory decisions in a few minutes.
How accurate are online safety stock and reorder point calculators?
Online calculators are only as accurate as the assumptions behind their formulas. Most safety stock and reorder point calculators, including the ones here, assume demand is roughly normal and stable and that lead times are fixed. Under those conditions they give a reasonable estimate.
When demand is lumpy, seasonal or shocked, or when lead times move, the textbook formula tends to under or over-size the buffer. Closing that gap is exactly what probabilistic, AI-driven planning is built for, by treating demand as a distribution rather than a single number.
Safety stock formula vs probabilistic AI: what is the difference?
The classic safety stock formula turns uncertainty into one fixed number: a service factor multiplied by demand variability and the square root of lead time. It is transparent and easy to compute, but it assumes a single, normal demand pattern for every item.
Probabilistic AI takes a different route: it forecasts a full range of likely demand for each item and sizes inventory against that distribution, so buffers adapt to how volatile each product really is. This is the approach behind Flowlity's inventory optimization, and it is why the same service level can often be reached with less stock.
Are Flowlity's Supply Chain tools free to use?
Yes. Every calculator and simulator in this collection is completely free, needs no sign-up, and runs directly in your browser. They are illustrative, textbook models meant to help Supply Chain teams learn and estimate quickly, not outputs of the Flowlity platform.
If you want to see how these principles work on your own data, you can book a demo of the Flowlity platform.
How does Flowlity go beyond these calculators?
These tools each solve one formula in isolation. Flowlity connects them into a single planning platform: it forecasts demand with probabilistic AI, sizes safety stock and inventory targets automatically for each item, and proposes supplier orders, then flags only the products that need a human decision.
Instead of recalculating a buffer by hand, planners work from a live plan that already accounts for uncertainty, across demand planning, inventory optimization and supply. That is the shift from a static calculator to AI-driven Supply Chain planning.