.svg)
.svg)
Returns forecasting: stop netting, start modeling returns

Why netting returns into safety stock creates blind spots
The standard playbook nets an assumed return rate against the demand forecast, or pads the buffer by a few extra days to "cover" returns. Both approaches collapse two different questions into one number.
How much stock should I hold against demand uncertainty is a different question from how many units are physically coming back into my warehouse next Tuesday, and folding the second into the first hides the exact information a planner needs to size replenishment correctly.
The result shows up as a chronic mismatch: warehouses that are simultaneously overstocked (because nobody subtracted the units already sitting in a return truck) and understocked (because a fast-return category got the same generic buffer as a slow-return one). A returns flow that is not tracked as a distinct number cannot be sized, timed, or trusted, which is exactly why it keeps getting waved away as "noise."
The phantom-returns trap
Here is the mistake that causes the most damage, and it is subtle enough that teams built processes around it without noticing.
If you calculate expected returns from your sales forecast rather than from what you actually shipped, you will predict returns for units that were never sold, because the item was out of stock that week. The forecast said 100 units would go out the door; only 40 did; but the returns model, blind to that gap, still expects roughly half of the phantom 100 to come back.
Warehouses end up staffed and stocked for returns that can't exist.
The fix sounds almost too simple: calculate the return rate and the return delay from real, historical sales-to-return mapping (matching outbound orders to the returns that eventually came back against them), then apply that rate and delay to the constrained outflow, meaning the smaller of what was actually available to sell and what the forecast called for, not the forecast in isolation. Applied to a mid-market e-commerce distributor selling fashion accessories across several regional warehouses, this single change (real outflow instead of theoretical forecast) was the difference between a returns model the planning team could trust and one they'd been quietly overriding by hand for years.
Return rate and return delay are not universal constants
The second mistake is treating return rate as one number for the whole catalogue. It isn't, and the spread can be dramatic.
Imagine a mid-market apparel retailer running a single blanket return-rate assumption across its book: a basic, frequently repurchased item and an occasion dress bought for a single event do not return at anything close to the same rate, and averaging them produces a number that is wrong for almost everything it's applied to.
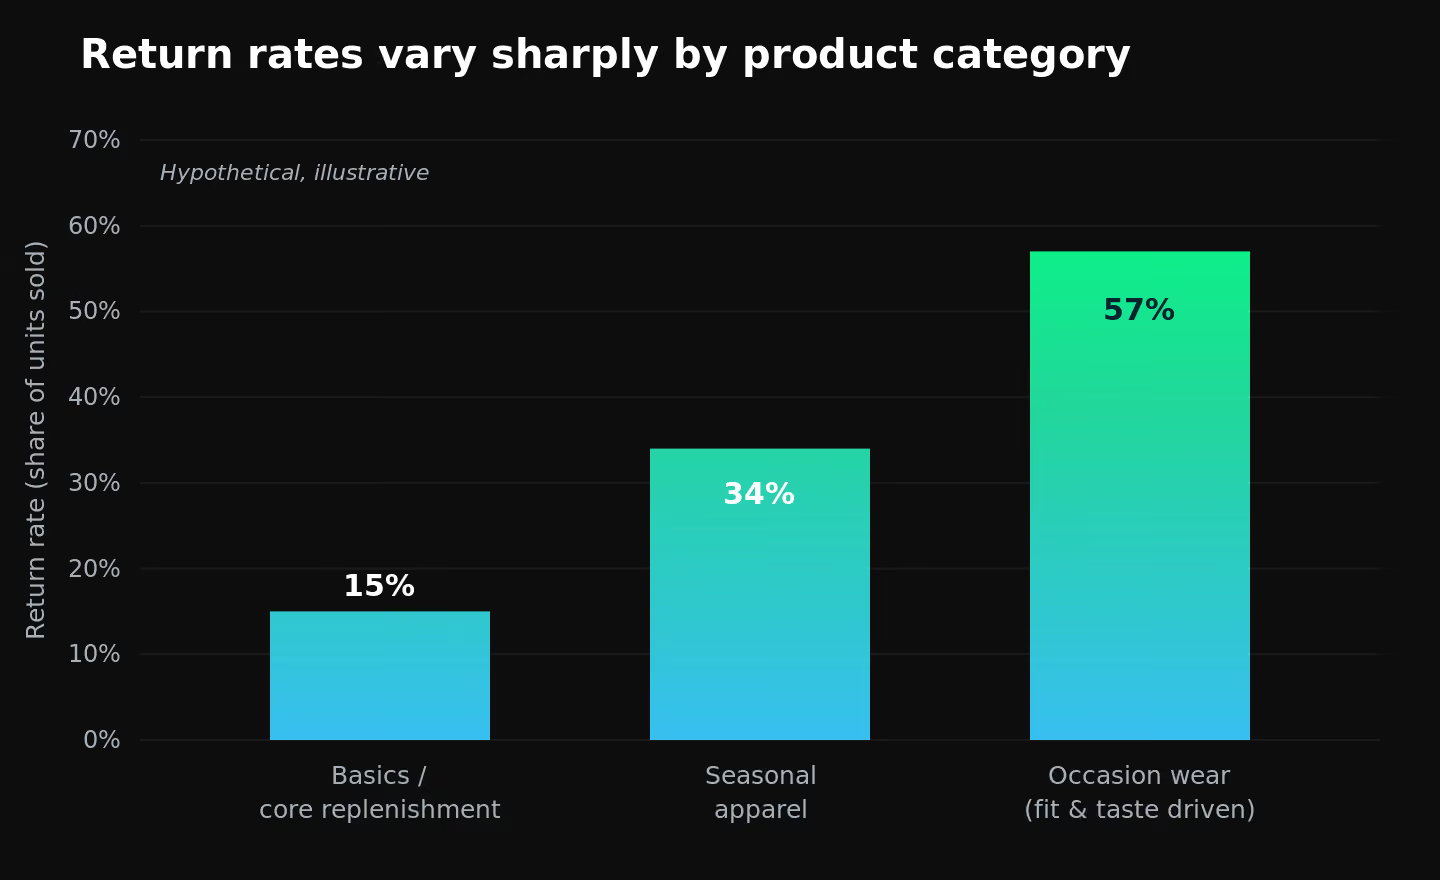
Return delay is just as uneven, and it's driven by channel rather than product. A returns policy might allow two weeks through a company's own online store and well over three months through a marketplace partner, which means the same unit sold on the same day can come back at wildly different points depending on where the sale happened. A return-rate-and-delay calculation that doesn't split by channel will average away exactly the timing information a warehouse needs to plan inbound capacity.
None of this needs to be a black box. Return rate and return delay can both be computed directly from historical sales-and-returns data, at whatever granularity (SKU, product family, channel) the variance actually requires, and the resulting numbers should be transparent enough that a planner can explain them in a sentence, not just point at an "AI decided" output. Planners who inherit a returns model they can't explain don't trust it, and a model nobody trusts gets manually overridden until it's effectively not running at all.
When returns are the business, not the exception
Retail returns are the common case, but the same logic gets pushed even further in circulation-based business models like clothing rental or equipment subscription services, where a unit's entire life is outbound shipment, inbound return, refurbishment, and outbound again. In that model, the "return" isn't leakage against a sales number, it's half of the operating cycle, and forecasting has to run on outbound and inbound circulation volume rather than a traditional per-SKU demand curve. A subscription-based apparel rental company approaching this problem, for instance, needs its planning tool to treat inbound returns as a first-class forecasting input from day one, not a correction applied after the fact, because there simply isn't a "normal" demand forecast underneath it to correct.
That's a useful extreme case to keep in mind even for a conventional retailer: it's a preview of what happens when a returns model that was designed as an add-on gets asked to carry real operational weight. If your returns volume is already a meaningful fraction of your outbound volume, you are closer to that circulation model than you might think, and the "just adjust safety stock" approach is closer to breaking than it looks.
Turning the returns forecast into a distinct supply source
Once return rate and return delay are calculated properly, the returns forecast should feed replenishment as its own inbound supply source, sitting alongside (not folded into) the external purchase order.
Practically, that means, for a given week, the units you need from a supplier equal:
- the demand forecast for that week,
- minus the units already in your warehouse,
- minus the units your returns model expects to land that same week.
Skip that last term and you systematically over-order, because you're buying supply you were already going to get back for free.
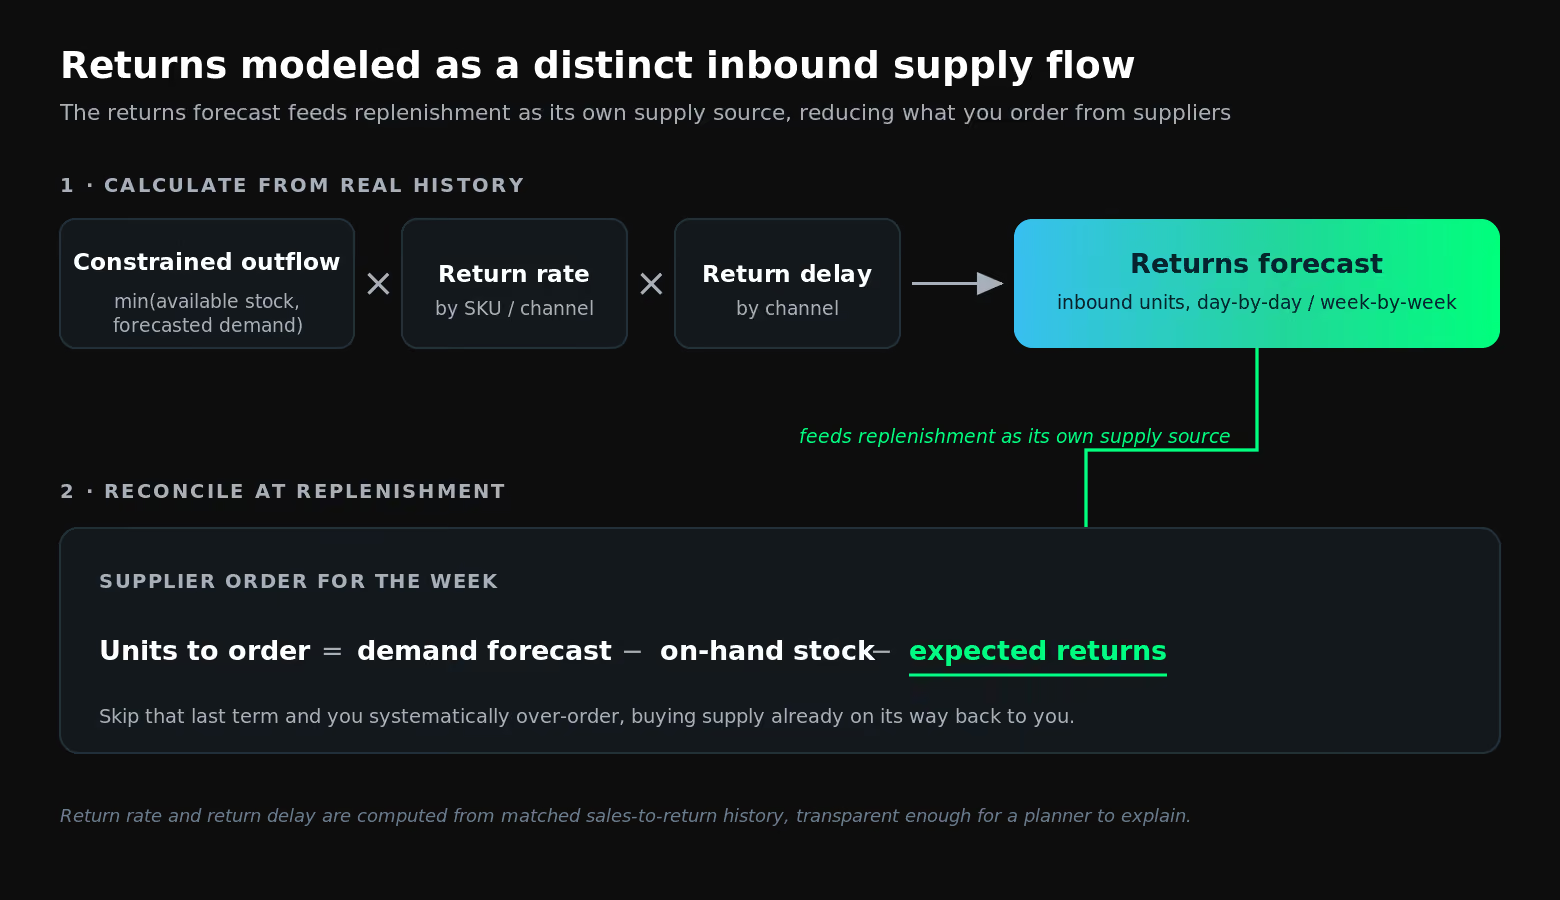
This also changes what a planner needs to see day to day. A returns model surfaced as a distinct, visible line lets a planner spot when a product's return rate is drifting (a sign of a quality or listing problem worth escalating) in a way that a number silently absorbed into a bigger buffer never will. Pairing that visibility with centralized AI demand planning means the returns signal and the demand signal are reconciled in the same place, rather than living in two disconnected spreadsheets that someone has to manually cross-reference every week.
Building a returns model you can actually explain to your CEO
The single hardest requirement in any returns-forecasting conversation isn't the math, it's transparency. Planners who are asked to defend a number in front of leadership need to say more than "the model said so." A returns model built as return rate times return delay times constrained outflow is auditable in a way a black-box adjustment never is: every input traces back to real sales and returns history, and every output can be recomputed by hand if someone asks.
That transparency requirement is really the same one behind sizing safety stock buffers to real risk rather than a blanket service-level target: the goal in both cases is a number a planner can stand behind, not a number that happens to look reasonable. Returns forecasting done well doesn't replace that discipline, it extends it to the other half of the flow, the units coming back in instead of just the units going out. Left unmanaged, that inbound half behaves like demand variability amplifying uncontrolled through the chain: a small miss in the returns assumption cascades into overstocked warehouses, mistimed labor planning, and false urgency on purchase orders that should never have been placed. Modeled properly, it becomes just another well-understood input, the same way Groupe Lemoine's move to AI-driven inventory optimization turned a fragmented, manually reconciled planning process into one the team could see across its whole network and trust day to day.
Ready to stop over-ordering stock that's already on its way back? Book a demo.
Level up your supply chain with AI.
Get a demo


FAQ
Find everything you need to know right here.
What is returns forecasting?

Returns forecasting is the practice of predicting how many units of a product will come back into a warehouse, and when, based on what was sold and the behavior of returns for that product or channel historically. It has two parts: a rate (what share of units sold eventually return) and a delay (how long, on average, between the sale and the return). Done well, a returns forecast produces a day-by-day or week-by-week estimate of inbound return volume, the same way a demand forecast produces a day-by-day or week-by-week estimate of outbound sales. That estimate then feeds into replenishment planning so warehouses order less from suppliers when a meaningful volume of stock is already on its way back to them. Returns forecasting matters most in categories with high return rates (fashion, footwear, categories driven by fit or personal taste) and in any circulation-based business model, such as equipment or apparel rental, where inbound returns are a core, permanent part of the operating cycle rather than an occasional correction.
Returns forecasting vs demand forecasting: what's the difference?
Demand forecasting predicts outbound volume: how much of a product customers will buy in a given period. Returns forecasting predicts inbound volume: how much of what was already sold will come back. They are related but distinct calculations, and treating them as one blended number is where most returns processes go wrong. A demand forecast that's too high inflates purchasing directly; a returns forecast that's wrong inflates purchasing indirectly, by causing a warehouse to under-credit the supply that's already circulating back to it. The two forecasts should be calculated separately, from separate historical signals (sales history for demand, sales-to-return matched history for returns), and then reconciled together at the replenishment stage, where the net requirement from a supplier accounts for both what's expected to sell and what's expected to come back.
Why doesn't a standard safety stock buffer solve the returns problem?
A safety stock buffer is sized to absorb demand and lead-time uncertainty: the buffer protects against a bad forecast or a late supplier. Returns are a different kind of variability, with their own timing pattern (a delay, not instant), their own driver (past sales, not future demand), and their own wide variance by product and channel. Padding a generic buffer to "cover returns" mixes those two problems into one number that fits neither well: it's too blunt to reflect the fact that one product returns at three times the rate of another, and it's structurally incapable of telling a planner when a specific batch of returns is actually due to arrive. A returns model calculated on its own, from real return rate and return delay, gives planners a number they can act on days or weeks in advance, rather than a buffer that just quietly absorbs the surprise after the fact.
How do you calculate return rate and return delay?
Return rate and return delay are both calculated from historical order data by matching each returned unit back to the original sales order it came from.
Return rate is the share of units sold, over a defined lookback window, that were eventually returned, calculated at whatever granularity (SKU, product family, or channel) the variance in your catalogue actually requires; a single company-wide average tends to be wrong for almost every individual product it's applied to.
Return delay is the average time between the sale date and the return date for that same matched population, and it should be split by sales channel wherever return policies differ, since a return window that runs two weeks through one channel and several months through another produces very different inbound timing for what looks like the same product.
Once both figures are calculated, they're applied to the constrained outflow (the smaller of available stock and forecasted demand, not the forecast alone) to produce a day-by-day or week-by-week returns forecast.
How does Flowlity handle returns forecasting?
Flowlity calculates return rate and return delay directly from historical sales-and-returns data, at the SKU, product family, or channel level depending on where the variance actually lives, rather than applying one blanket assumption across a catalogue. That returns forecast is then treated as its own inbound supply source inside the platform's replenishment logic, alongside external purchase orders, so that expected returns reduce what actually needs to be ordered from a supplier rather than sitting invisibly inside a padded safety stock number. The same AI-driven inventory optimization engine that powers demand forecasting and buffer sizing extends to this returns flow, which means planners see one reconciled view instead of maintaining a separate spreadsheet to guess at returns by hand. For circulation-heavy business models, including rental and subscription services where inbound returns are a permanent part of the operating cycle rather than an exception, that same logic scales from a percentage-of-sales adjustment to a first-class forecasting input.