.svg)
.svg)
Stockouts: causes, consequences and how to prevent them

A stockout happens when demand for an item exists but the item is not available in the right location at the right time. The visible cost is the lost sale. The larger cost is what compounds underneath: eroded customer trust, lower-margin substitution, and the operational chaos of firefighting. Preventing stockouts in 2026 means moving from point forecasts to probability-aware buffers, and from dashboards that warn you to systems that recommend the decision early enough to act.
A stockout does not just cost a sale. It costs the customer's trust, the supplier's emergency fee, and the planner the rest of the week.
Every Supply Chain director has lived that Tuesday morning. A best-seller drops to zero, marketing has just paid to push it, expedited freight gets booked at three times the normal rate, and the planning team rebuilds the schedule. The profit and loss statement will say "lost margin." The real damage is everything else. The question for 2026 is not how to forecast better. It is how to prevent stockouts before they enter the next planning cycle, by combining clean master data, dynamic inventory buffers, and AI that surfaces decisions early enough to act on. This guide breaks down what stockouts actually cost, why traditional prevention tactics plateau, and the six levers that work in mid-market industry, retail, and distribution.
What a stockout is, and the rate that actually matters
A stockout, also called an out-of-stock (OOS), is when demand for a stock keeping unit (SKU) exists but the SKU is not available in the right location at the right time. The textbook definition is binary. The operational reality is graded: a partial fill, a lost basket online, a production line idling for two hours, a customer accepting a substitute SKU at lower margin. All of them count.
The metric most teams track is the stockout rate: the number of SKUs unavailable divided by the total active SKUs, times 100. Useful, but coarse. A 2% stockout rate on a 30,000-SKU catalogue means 600 references are down. If those 600 are the top movers, the rate is hiding a service-level catastrophe. The metric that actually correlates with revenue and trust is the weighted stockout rate, where each SKU is weighted by its sales velocity. A best-seller down for a day is not equivalent to a long-tail SKU down for a week. Mid-market teams running on classic enterprise resource planning (ERP) reports rarely have this view by default, the visibility that AI demand planning is built to provide.
Try it on your own numbers: the weighted stockout rate visualizer below shows how a calm-looking headline rate turns into a much higher weighted rate once the stockouts land on your best-sellers.
How to measure and track your stockout rate
A measurement the team trusts is the prerequisite for any improvement. Two metrics are worth tracking together. The stockout rate (number of stockout-days divided by total available SKU-days, times 100) tells you how often you are out across the catalogue. The weighted stockout rate applies each SKU's sales velocity to that same calculation, so it reflects revenue rather than reference count. A low weighted rate on the top 200 SKUs is worth far more than a low unweighted rate spread across the long tail.
Track the rate weekly, broken down by ABC class, by site, and by lead time bucket. If the rate is dropping only on long-tail SKUs, the buffer is being shifted, not the stockout cause. If the rate is dropping on A-class SKUs with stable or lower inventory, the planning model is working. Set the service-level target per SKU from its economics, not as a single blanket number, so the buffer chases the target that matters rather than an average that hides the risk.
The 6 most common causes of stockouts
The search results on stockouts are saturated with lists of five or six causes. What they usually miss is that the causes rarely act alone: a forecast error and a supplier delay compound, and a master data error makes both of them invisible until the SKU is already at zero.
1. Forecast errors on demand.
Statistical models built on stable history fail when promotions, weather, competitor moves, or end-of-life cycles enter the equation. A single 30% miss on a four-week lead time SKU is enough to drain the buffer.
2. Master data quality.
Wrong unit of measure, missing minimum order quantity, an outdated bill of materials (BOM), or a supplier code routed to the wrong plant. These data errors do not stop the system from running, they stop it from running correctly.
3. Supplier delays and lead time variability.
The lead time on the master file is often the supplier's marketing number. In practice, teams routinely discover the real door-to-door time is far longer than what the system holds, especially when production time and transport time were entered separately and never recombined. The real distribution has a tail, and the tail is what creates stockouts.
4. Demand spikes the forecast did not see.
Promotions launched without planning alignment, viral moments, business-to-business (B2B) framework orders called off contract earlier than planned, weather events. Statistical forecasts smooth these out by design.
5. Inefficient replenishment.
Reorder points calculated once a year on average demand and average lead time. The world has not been average for several years. Static safety stock cannot absorb volatility it was not sized for. In frozen and chilled ranges the buffer is capped twice over, by shelf life and by the freezer space available to hold it, which is what makes cold storage capacity planning inseparable from the forecast.
6. Internal coordination gaps.
Sales pushes a promotion, marketing changes the launch date, finance freezes purchasing for month-end, production swaps the schedule for a hot order. Each move is rational. The cumulative effect is the amplification that turns small demand swings into large supply swings, and a stockout on a B-class SKU nobody owned.
Attacking each cause in isolation helps, but none of them fix the underlying problem: the planning process is reactive and the decisions arrive too late.
The real cost of a stockout: lost sales, trust, substitution, chaos
The macro number is the global inventory distortion cost of $1.77 trillion in 2023, of which roughly $1.2 trillion is attributed specifically to out-of-stocks (source: IHL Group via Retail TouchPoints). It frames the stakes; it does not capture what happens inside a mid-market company, where three layers compound underneath the visible lost sale.
Trust damage. A consumer who finds a competitor on the second try does not come back automatically. A B2B buyer who runs a line short of a critical component starts re-qualifying a second source the same week. There is no line item for trust on the profit and loss statement, which is precisely why it gets underweighted.
Substitution and margin erosion. When the requested SKU is missing, the customer often accepts a substitute, frequently a higher-spec, lower-margin SKU because that is what was available. The sale is recorded, the margin is silently eroded, and none of it shows up as a stockout in the dashboard.
Operational chaos. Every stockout triggers a cascade: expedited freight, supplier escalations, production resequencing, customer communication, internal blame loops. A planner can lose days to firefighting. Nobody does strategic work because everyone is solving yesterday's problem. The IHL number is real. The shop-floor number is bigger.
Why traditional prevention tactics plateau
Every Supply Chain team has tried the standard playbook: static safety stock, monthly ABC reviews, KPI dashboards, supplier scorecards, Sales and Operations Planning (S&OP) meetings. It works, up to a point, and then it plateaus. Understanding why matters before adding any new tool.
Static safety stock assumes the world is normal. Classic formulas multiply a service-level Z-score by the standard deviation of demand and the square root of lead time. The math is sound, the inputs are not. Demand variability is computed on a year of history that no longer represents the next quarter, and lead time variability is averaged across suppliers that behave very differently. The result is one buffer too high on stable SKUs and too low on volatile ones. Reworking that math into a dynamic safety stock calculated with AI is where most of the gain hides.
Monthly ABC reviews are too slow. The classification was correct the day it was published. Three weeks later, a B-class SKU hit by a promotion is now a top mover. The team only sees it at the next cycle, by which point the stockout has already happened.
Dashboards tell you the problem, not the decision. A dashboard that flashes red on a stockout risk is a post-mortem tool. The planner still has to interpret the alert, query the data, talk to the supplier, and decide whether to reroute, expedite, or substitute. By the time the decision is made, the SKU is already at zero. The plateau is not a failure of tactics. It is a structural ceiling: human-driven processes calibrated on monthly cycles cannot keep up with daily volatility across tens of thousands of SKUs.
From forecast to decision: what AI actually does to prevent stockouts
The way AI in Supply Chain planning is most often sold today is as a better forecast: lower mean absolute percentage error (MAPE), a prettier graph. The honest version is that better forecasts help, but a single number does not capture risk. Useful AI for stockout prevention does two things differently.
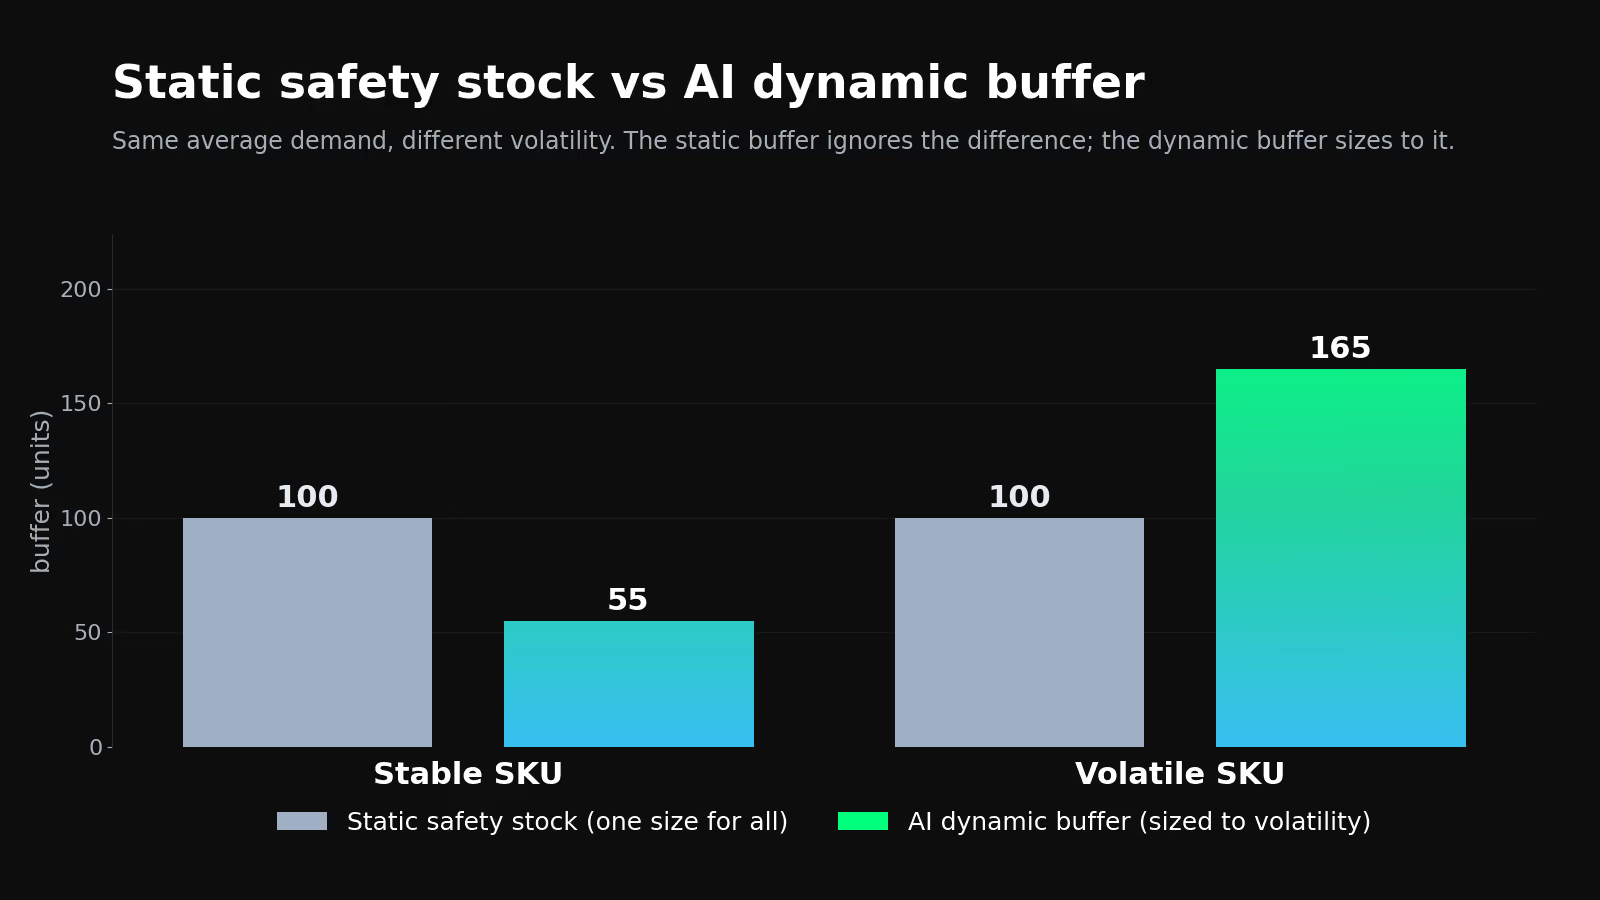
First, it works with probability distributions, not point forecasts. Instead of saying "next week we will sell 1,200 units of this SKU," it says there is a 50% chance of selling between 1,000 and 1,400, a 10% chance of exceeding 1,600, and a 5% chance of missing below 800. That distribution lets the algorithm size a buffer against the realistic upper range of demand, not against the mean. Two SKUs with the same average sales but different volatility get two different buffers, automatically. It is the same shift toward data-driven, probabilistic safety stocks. Static safety stock cannot do that.
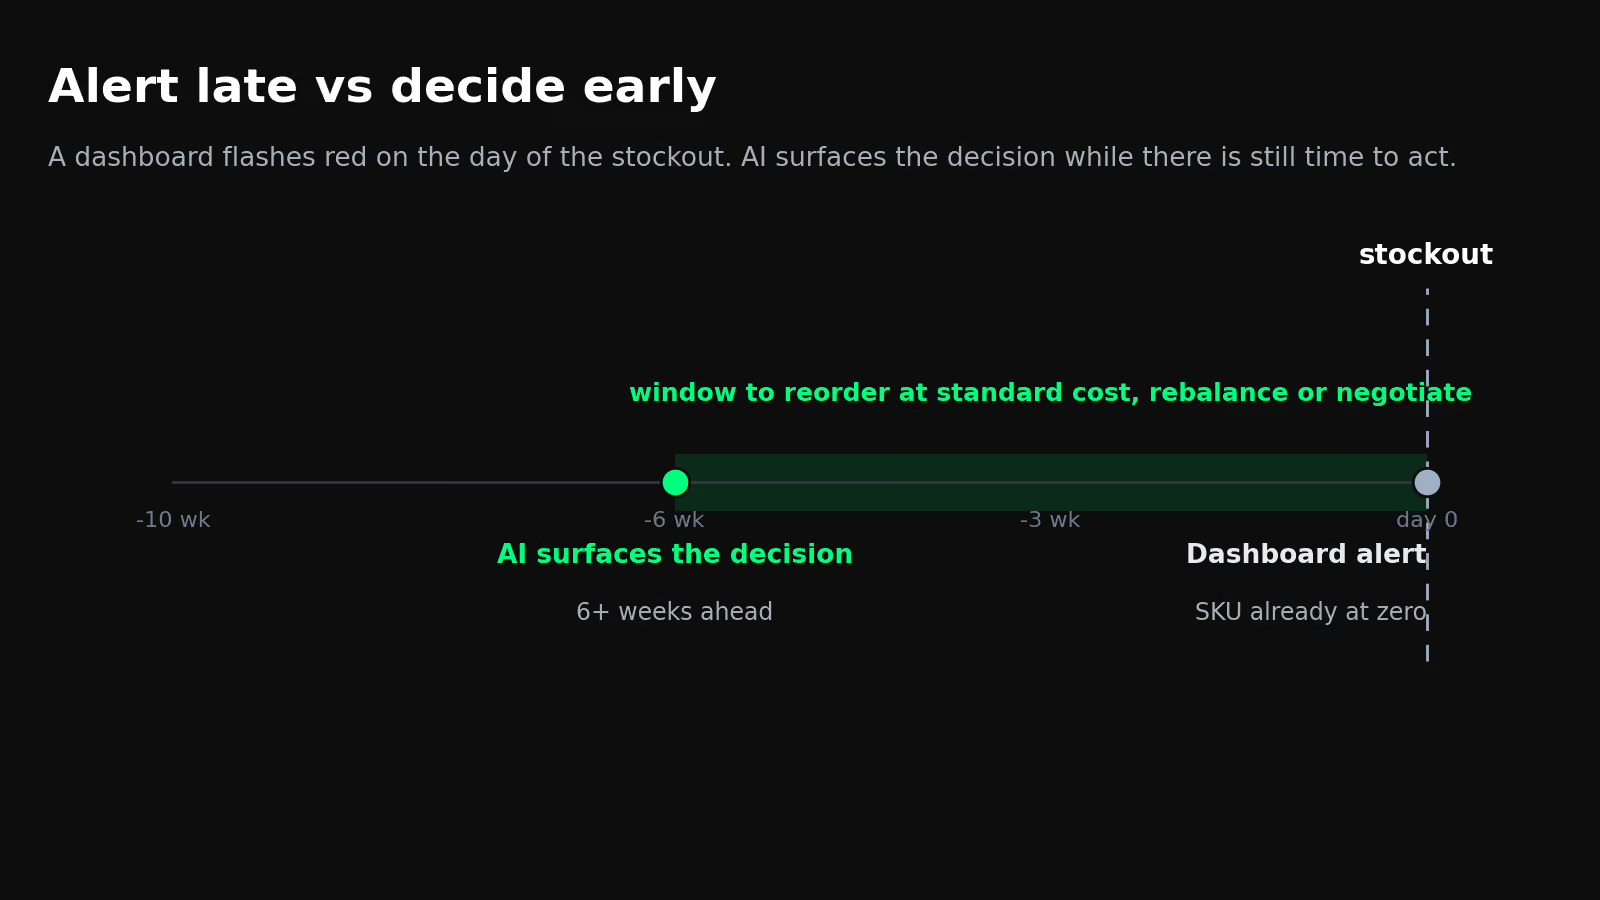
Second, it surfaces decisions early, not alerts late. An engine that learns demand patterns continuously can flag a stockout risk four, six, or ten weeks ahead, when there is still time to reorder at standard cost, negotiate with the supplier, or rebalance inventory across sites. The shift is from monitoring to anticipating, and from alerting to recommending the next action.
McKinsey research finds that applying AI-driven forecasting to Supply Chain management can reduce errors by 20 to 50%, and translate into a reduction in lost sales and product unavailability of up to 65%. The error reduction is the technical effect. The improvement on availability is what matters operationally: it is the gap between firefighting and planning. This is the foundation of AI-driven supply planning, which sizes dynamic buffers against the uncertainty range, automates supplier orders, and surfaces only the exceptions that need human judgement.
Static safety stock vs dynamic, probability-aware buffers
6 levers that work in 2026
The tactics below are not new. What is new is the ability to run them together, automatically, on a catalogue of 5,000 or 50,000 SKUs without burning out the planning team.
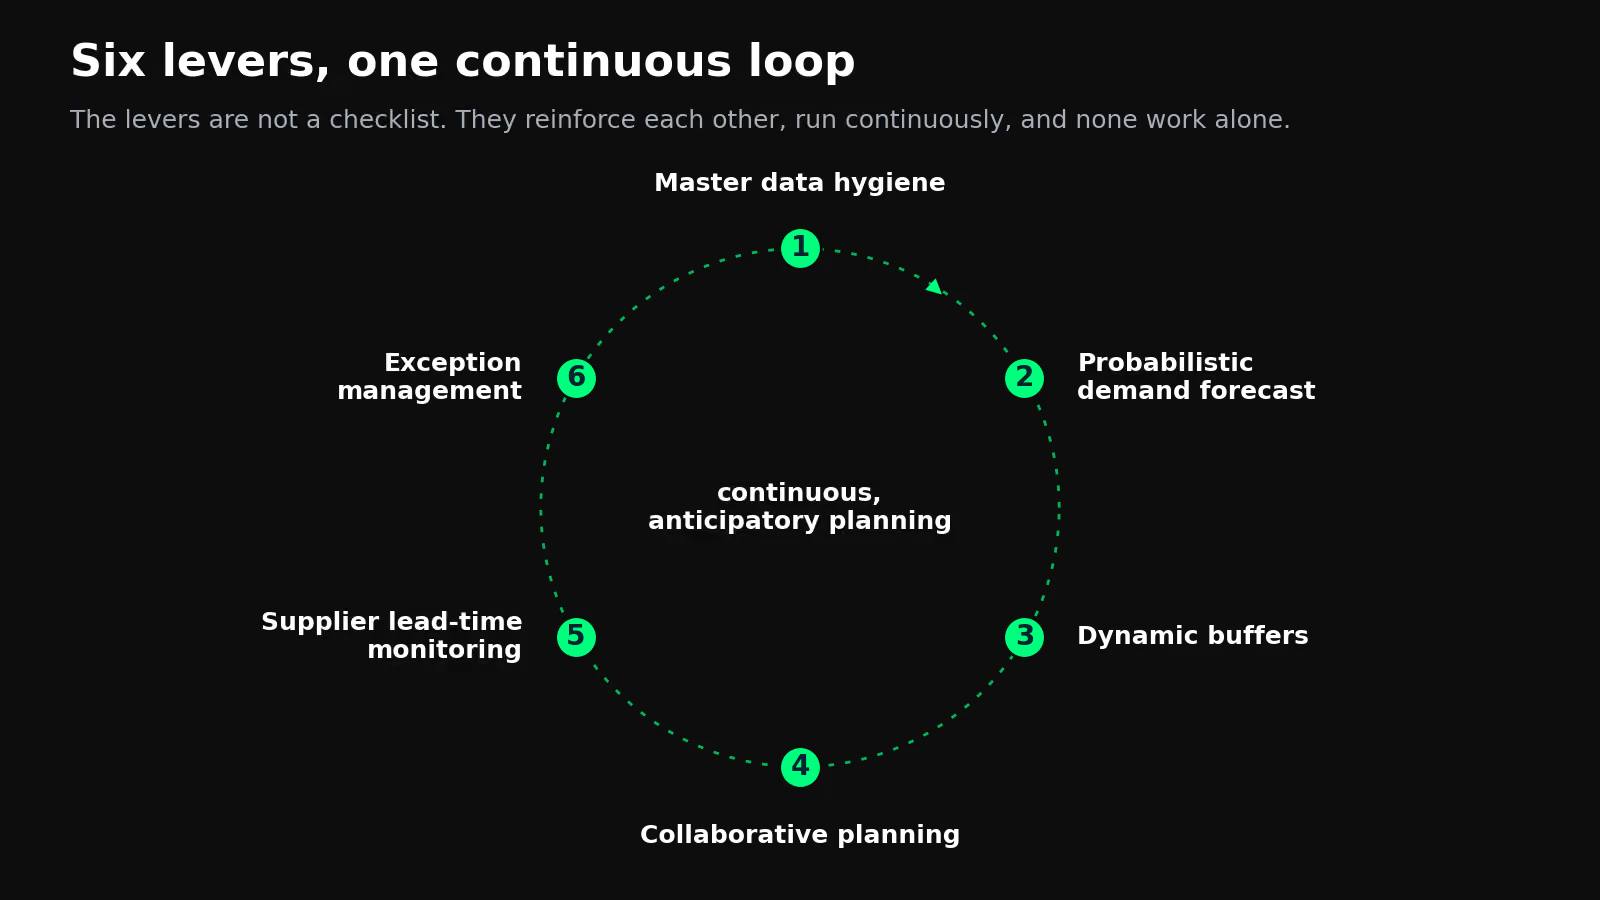
The connective tissue across the six is the move from monthly to continuous, and from reactive to anticipatory.
How Flowlity customers cut stockouts
Magotteaux, a mid-market industrial manufacturer serving the cement and mining sectors, cut stockouts by 8% while reducing inventory value by 13% and stock coverage by 22%. The triplet is the point: stockouts and inventory moved in the right direction at the same time, which is the test that separates a real planning improvement from a buffer reshuffle. Once the team could act on exceptions instead of rebuilding the same report every week, the planning function shifted from reactive to anticipatory.
Saint-Gobain Sekurit, the automotive glass replacement division of the building-materials group, moved its service level from 95.8% to 97.2% and now runs at an average 97% availability rate across its distribution network, up two points year on year. The gain came from sizing buffers against real uncertainty rather than against a yearly average, which released working capital while improving service at the same time. In a distribution model where a customer who cannot find the item locally simply calls a competitor, those two points of availability are the difference between keeping and losing the account. Different sectors, different starting points, same direction of travel: stockouts and inventory both go down, and the planning team stops firefighting.
Level up your supply chain with AI.
Get a demo

FAQ
Find everything you need to know right here.
What is a stockout and how can you avoid it?

A stockout occurs when an item is no longer available at the moment a customer—or a production line—needs it. This leads to missed sales and can harm customer satisfaction. To prevent stockouts, it’s important to rely on accurate demand forecasts, maintain adequate safety stock, and monitor inventory levels in real time. Collaboration with suppliers (to reduce lead times or secure faster replenishments) and the use of alerting tools can also help avoid these situations.
How does an ecommerce Inventory Management Software reduce stockouts?
An Inventory Management Software reduces stockouts by improving demand forecasting, sizing safety stock based on uncertainty, adjusting reorder points dynamically, and flagging risks early (supplier delays, demand spikes, allocation issues) so teams can act before availability drops.
Can retail inventory management software reduce stockouts and overstocking?
Absolutely. By combining accurate inventory tracking with automated replenishment and optimization logic, retail inventory management software helps balance availability and carrying costs, reducing both stockouts and excess inventory. The mechanism is simple: when replenishment decisions reflect real demand variability and lead time risk per SKU and location, buffers concentrate where they actually protect service and shrink where they only generate waste. Dynamic, probabilistic logic outperforms static reorder points in retail environments, where demand shifts quickly with promotions, seasonality and local effects. The result is a healthier service level at lower working capital, which is the outcome retailers track to judge whether the tool earns its place.
What is the difference between a stockout and a shortage?
A stockout is a localised, time-bounded event: a specific SKU is unavailable in a specific location for a specific period. A shortage is a broader, often supply-side condition where the market itself cannot meet aggregate demand for a category. Most planning teams can prevent stockouts through better buffers and forecasts. Shortages typically require sourcing-strategy changes such as multi-sourcing, regional alternatives, or redesign that go beyond the planning function. The distinction matters because the two problems have different owners: a stockout is usually a planning decision arriving too late, while a shortage is a procurement and strategy question.
How much does a stockout actually cost?
The global figure cited most often is IHL Group's $1.77 trillion in inventory distortion in 2023, of which roughly $1.2 trillion is attributable to out-of-stocks. Inside a single mid-market company, the visible cost is the lost margin on the missed sale. The full cost includes substitution at lower margin, expedited freight, supplier escalation fees, customer trust erosion, and planner bandwidth lost to firefighting. Because most of those layers never appear as a line item, teams that only track the missed sale consistently underestimate what stockouts are costing them.
How do you prevent stockouts on best-selling products?
Best-sellers concentrate revenue and concentrate stockout risk, so they deserve stricter rules than the rest of the catalogue. First, size their buffer against the upper range of demand, not the average: probabilistic forecasts and dynamic safety stock are non-negotiable on top movers. Second, monitor supplier lead time against contract specifically on these SKUs, because a late delivery here is far more expensive than on a slow mover. Third, pull commercial signals early: every promotion or campaign on a top mover should flow into the demand plan before it launches, not after. The combination is what keeps a best-seller available through exactly the demand spikes that would otherwise drain it.
What is the role of demand planning software in preventing stockouts?
AI-driven demand planning software replaces single-number forecasts with probability distributions, which lets the algorithm size buffers against realistic upper ranges of demand rather than against historical averages. Modern platforms also update the forecast continuously as new sales data arrives, surface SKUs at risk weeks ahead of the stockout, and recommend the next action, whether that is to reorder, rebalance, or escalate. The shift is from forecasting better to deciding earlier, which is the part of the problem that actually prevents the stockout.
How do companies balance inventory levels to prevent overstocking and stockouts?
The balance point depends on the cost of capital versus the cost of a stockout, SKU by SKU. A slow mover with high holding cost should run at a lower service-level target, accepting some stockouts. A top mover with high gross margin should run at a high service level even if inventory is heavier. Probabilistic planning makes this explicit: each SKU gets a service-level target tied to its economics, and the buffer is sized to hit that target with the minimum inventory. That is how the same model prevents overstocking and stockouts at once, instead of trading one for the other. The dedicated guide on how to optimize inventory without sacrificing service levels walks through the practical levers.