.svg)
.svg)
Spare Parts Inventory Management: Best Practices Guide

A plant can run a healthy service level on its finished goods and still lose two days of production to a seal worth a few tens of euros. That is the gap spare parts inventory management is meant to close, and it is why the methods that work everywhere else in the warehouse tend to fail here.
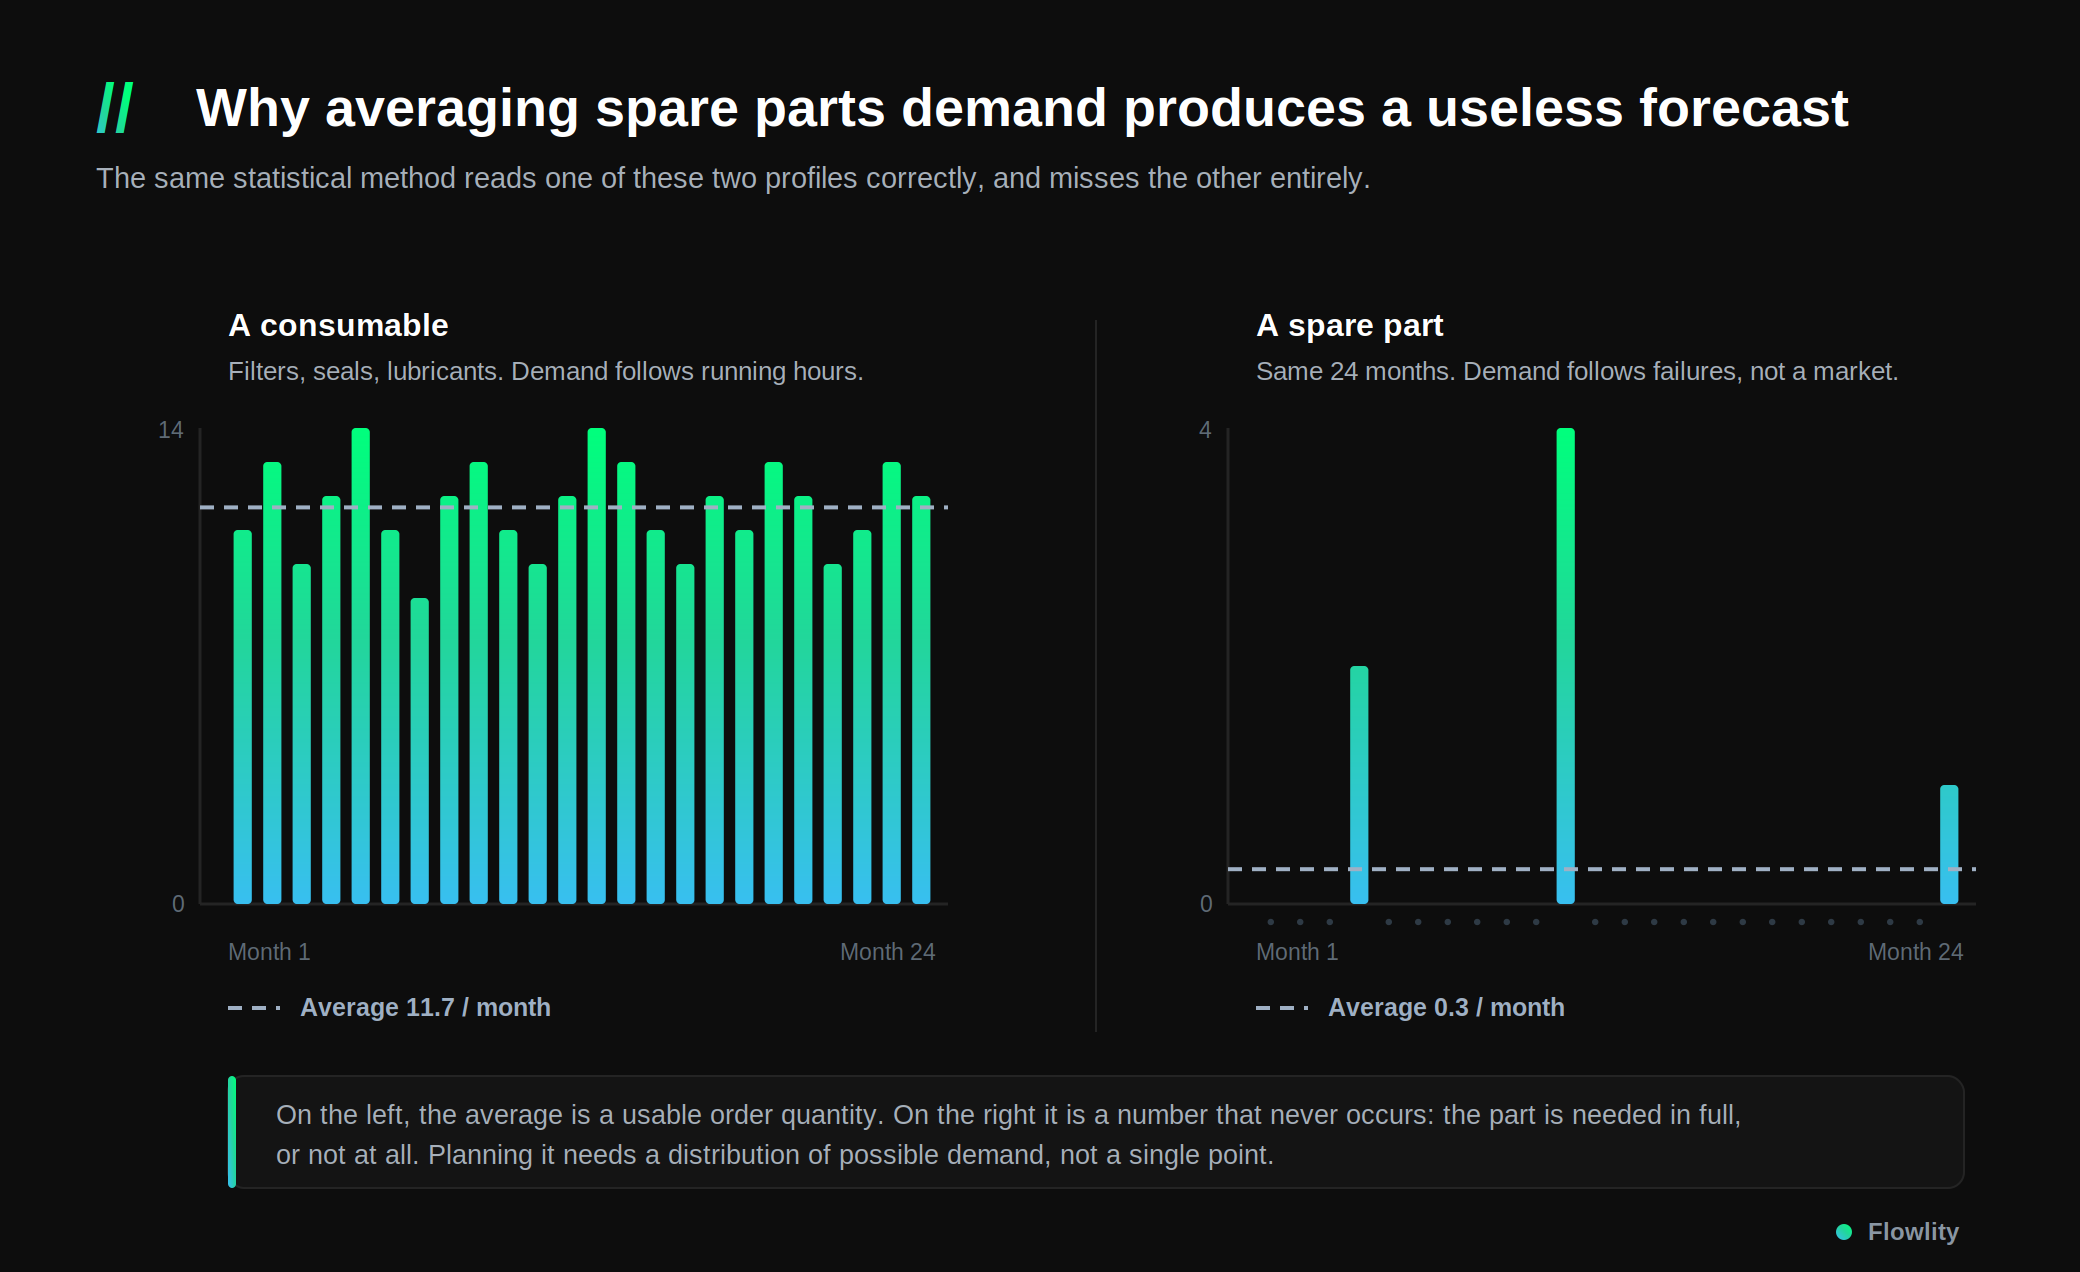
Spare parts do not behave like finished goods. Demand is intermittent, volumes are low, and the cost of a shortage has nothing to do with the price of the part. Averaging that demand produces a forecast of 0.3 units a month, which is mathematically defensible and operationally useless. So most organizations do the only thing left: they overbuffer, and watch working capital and obsolescence climb.
This guide covers what changes when you plan spare parts properly, from classification and forecasting through to systems, KPIs and the mistakes that keep stock high.
What is spare parts inventory management?
Spare parts inventory management covers the processes, rules and tools used to plan and control the replacement parts needed to keep equipment, machines or products running through their lifecycle. It spans demand forecasting, safety stock and reorder policies, the split between critical and non-critical parts, the connection to maintenance planning, and the arbitration between service level and cost.
What makes it its own discipline is the demand profile. Consumption is irregular and often driven by failure events rather than by a market. A part can sit untouched for eighteen months and then be needed within four hours.
Spare part, stock part, consumable: the distinction that sets your policy
These three get used interchangeably on the shop floor, and the confusion is expensive.
- A spare part is a replacement component held against the failure or planned replacement of a specific asset. Demand is event-driven.
- A stock part is any item held in inventory with a defined replenishment policy, whether or not it is tied to an asset.
- A consumable is used up in the course of normal operation: filters, lubricants, gaskets, fasteners. Demand is broadly proportional to running hours, so it is forecastable with conventional methods.
The practical consequence: consumables can be planned like ordinary inventory. Spare parts cannot. Applying one policy to both is the most common structural error in this area.
MRO, aftermarket and service parts
The same physical part goes by different names depending on who holds it, and each context has its own constraints.
MRO (maintenance, repair and operations) refers to parts and supplies a company holds to maintain its own equipment. The cost of a shortage is internal: downtime.
Aftermarket or service parts are parts a manufacturer or distributor holds to serve customers after the sale. The cost of a shortage is external: a customer who calls a competitor. This is where multi-echelon inventory optimization comes in, with central warehouses, regional hubs and dealers, and where fill rate becomes a commercial commitment rather than an internal target.
Why spare parts break traditional inventory planning
Four characteristics compound, and each one alone would be manageable.
Demand is intermittent and unpredictable. Long stretches of zero, then an immediate requirement. Moving averages and simple exponential smoothing have nothing to work with.
Criticality is decoupled from volume. The slowest-moving reference in the catalog can be the one that stops a line. Treating all SKUs (stock keeping units) by consumption value alone guarantees you underprotect the parts that matter.
Lead times are long and variable. Many spare parts are made to order, sometimes by a single qualified supplier, which makes replenishment the binding constraint rather than the demand side. A stockout is not corrected in a week.
And obsolescence runs quietly. Machines get replaced, references change, and stock that looked prudent becomes a write-off nobody notices until inventory review.
Add multi-site duplication, where each plant or depot plans independently and the same reference sits in six places, and you get the pattern most industrial companies recognize: too much stock overall, and shortages exactly where they hurt. Rebalancing that network is a distribution requirements planning problem before it is a purchasing one.
What this looks like at scale: inside an automotive glass aftermarket network
Abstract descriptions of the long tail only go so far. Saint-Gobain Sekurit AGR, the automotive glass replacement arm of the group, laid out the shape of its catalog on stage at the 2025 Supply Chain Event, and it is a useful reference point for anyone planning service parts.
The network runs three dedicated plants, one central hub serving Europe and export, and 30 local distribution centers. The catalog holds more than 12,000 references, around 8,000 of them carried in each country: roughly 4,000 windscreens, 1,500 backlites and 5,000 side windows, for about 2.5 million pieces a year.
That split explains the demand profile better than any statistical description. Every vehicle model, year and variant produces its own glass reference, so the catalog grows with the car parc while demand behind any single reference stays tiny and event-driven. Nobody plans to break a windscreen.
The service promise then fixes the constraint. Orders placed up to 18:00 ship for overnight or next-day delivery, because at the other end a fitter has a vehicle on the lift and a driver without a car. In the aftermarket, availability is not a support function. It is the product.
And the coverage target is deliberately not one number. The group aims to cover around 95% of windscreen needs, but around 80% on backlites and side windows. Same warehouses, same planners, two different service levels, set by what a shortage actually costs. That is criticality-based planning in practice, and it is the decision most organizations never make explicitly.
Classify before you optimize: ABC, XYZ and criticality
Classification is not paperwork. It is what lets you apply different rules to parts that behave differently, and it is the step most often done halfway.
Three axes matter, and they need to be crossed:
- ABC, by annual consumption value. Tells you where the money is. Sorting references by annual consumption value almost always shows a small minority carrying most of the stock value, and that is where individually reviewed policies pay for themselves. The rest can run on simpler rules without anyone losing sleep over them.
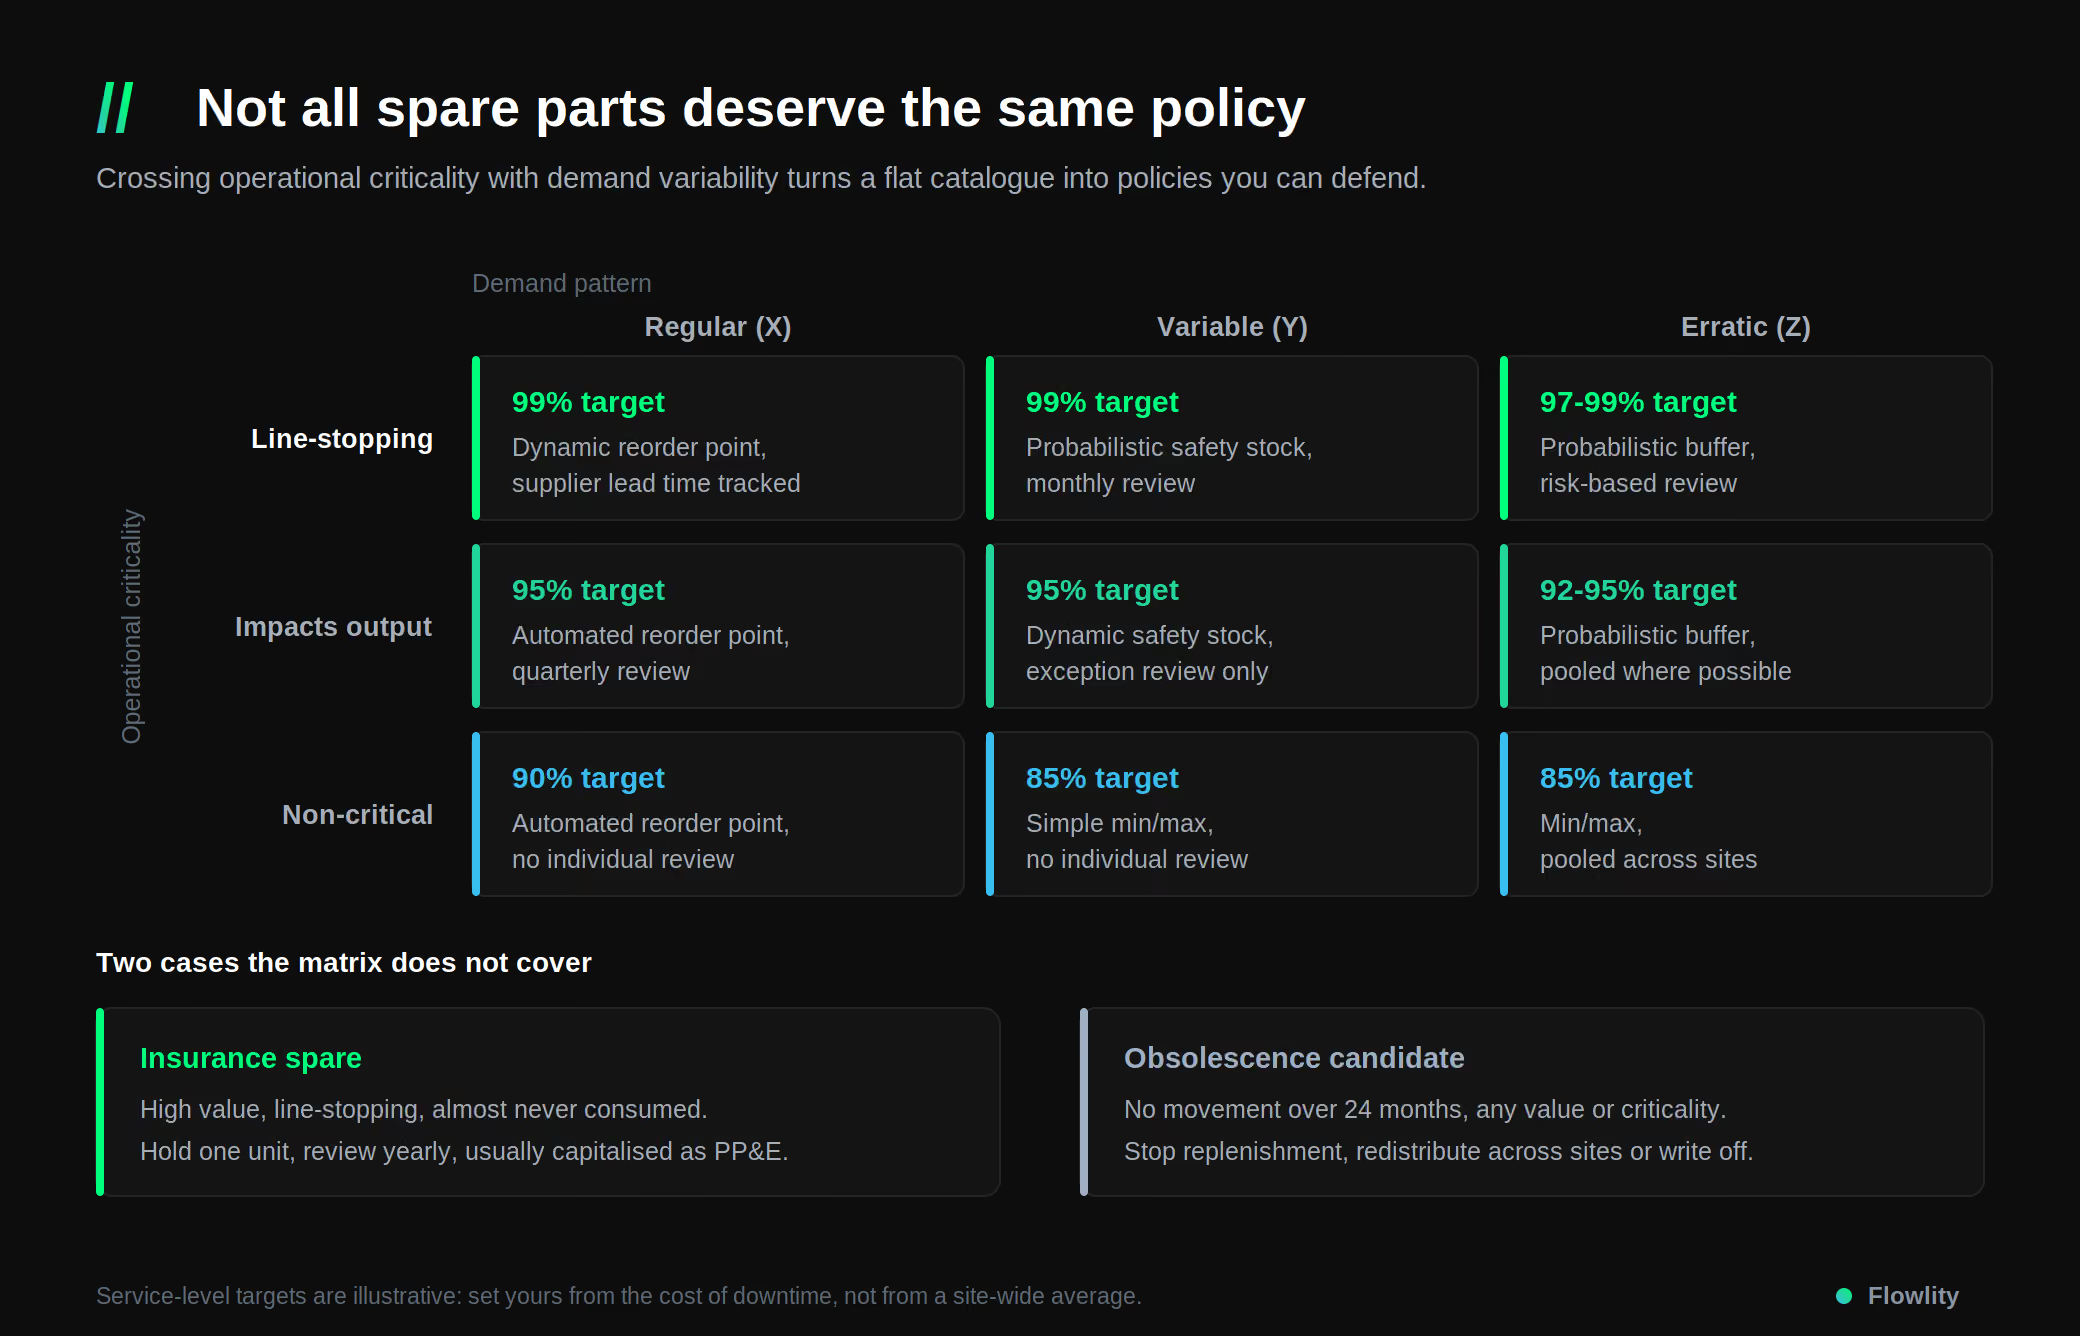
- XYZ, by demand variability. Tells you how forecastable the part is. X items are consumed steadily enough for a statistical forecast to mean something. Z items move in unpredictable bursts and need a probabilistic buffer rather than a point forecast, and most spare parts sit in Z.
- Criticality, by operational impact of a shortage. Tells you where the risk is. The question is not what the part costs, but what an hour without it costs: a stopped line, a missed customer commitment, a technician sent home. This is the axis that almost never exists in a transactional system, and the one that should set the service-level target.
Value alone will mislead you. A cheap part that stops production outranks an expensive one you can source in two days. Crossing the three axes turns a flat catalog into a handful of profiles, each with a defensible policy, and it is the prerequisite to any real inventory optimization.
The proportions are worth bracing for. When Sekurit AGR broke its catalog down by ABC class, the slowest-moving category on its own held more references than the A, B and C classes combined. On a service parts catalog the long tail is not the leftover you deal with at the end of the project. It is the bulk of the work.
Align spare parts inventory with maintenance data
Spare parts demand is not random. It is largely generated by maintenance activity, and that activity is planned. Yet in most organizations the maintenance plan sits in the CMMS (computerized maintenance management system) and never reaches the people setting stock levels.
Connecting the two converts part of an unpredictable demand into a scheduled one, much as demand sensing uses short-term signals to firm up a forecast. Preventive and condition-based maintenance plans tell you which references will be needed and roughly when. Failure and repair history tells you which assets actually consume parts, as opposed to which ones were supposed to. Neither requires new data collection, only that the two systems talk.
This is usually the cheapest improvement available, and it is skipped because it is organizational rather than technical.
Set safety stock on risk, not on averages
The most common mistake in spare parts inventory management is a static min/max threshold set once and rarely revisited. It fails in both directions at once: too much cover on parts whose demand has stabilised, too little on parts whose risk has grown.
For intermittent demand, demand variability matters more than volume, and a single-point forecast hides the uncertainty that should be driving the buffer. Probabilistic forecasting models the full distribution of possible demand rather than one number, which lets you set stock against an explicit service-level target: 99% on a line-stopping part, 85% on a non-critical one. The buffer then moves as consumption patterns and supplier lead times move.
Industrial operators who move from static rules to probabilistic, criticality-driven planning typically report inventory reductions in the high single digits alongside a service level increase, rather than a trade-off between the two. Saint-Gobain Sekurit AGR, the automotive glass replacement arm of the group, cut inventory by 9% while lifting its service level from 95.8% to 97.2%. Read how Saint-Gobain Sekurit rebuilt its spare parts planning.
Try it: interactive reorder point calculator
Enter your demand, lead time, variability and service level below to size your reorder point, and see why the textbook formula falls short for intermittent spare parts.
➡️ Open the full-screen reorder point calculator
What a spare parts inventory management system actually does
Definition
A spare parts inventory management system is a software layer that plans and optimizes replacement-part stock using demand data, policy rules and analytics. It does not replace the systems that record what happened. It decides what should happen next.
CMMS, ERP or planning tool: how to choose
There is no single best category, because three different tools solve three different problems, and most companies end up needing two of them.
A CMMS manages maintenance: work orders, equipment history, and the parts consumed on each intervention. It is the right system of record for maintenance, and it is generally not built to decide how much to hold.
An ERP (enterprise resource planning) or WMS (warehouse management system) handles transactions and movements: receipts, issues, valuation, locations. It executes replenishment rules faithfully, but the rules themselves are usually static thresholds someone set at go-live. A planning layer sits on top of it, which makes ERP and CMMS integration a selection criterion in its own right.
An inventory optimization or Supply Planning tool decides the quantities. It forecasts intermittent demand, calculates safety stock per part against a service-level target, rebalances across locations, and recalculates as conditions change. This is the layer most companies are missing, and it is why spare parts stock keeps growing while shortages persist.
So the useful question is not which tool is best. It is which layer you are missing. If you know precisely what you consumed but not what you should hold, the gap is in decision intelligence, not in tracking.
Four capabilities separate a planning tool that works on spare parts from one that does not: forecasting built for intermittent demand, safety stock that recalculates rather than sitting fixed, optimization across warehouses and sites, and exception-based alerting so planners look at the fifty references that need a decision instead of the twelve thousand that do not. That last point is where supply order management software turns a recommendation into an order somebody actually places.
Scope matters as much as features, and the order of deployment matters more than either. Sekurit AGR sequenced its rollout from the customer end inwards: sales forecasting and stock management at the 30 distribution centers first, then purchase forecasting at the central hub, then collaborative planning and production forecasting at the plants, and finally visibility for suppliers. Their own summary of the logic was that each step creates the value the next one needs. It is the honest answer to a question buyers ask in the wrong order: you cannot plan production or raw materials for service parts while the layer closest to the customer is still guessing.
Production constraints also have to travel inside the plan rather than sit beside it in a separate spreadsheet, so that what the tool proposes is already feasible on the shop floor.
One more criterion matters more than the feature list: how long it takes to get running against your existing systems.
"The implementation went very smoothly. The team is highly engaged and manages follow-ups very effectively."
David Daveau, IT Manager, Hutchinson
How AI changes spare parts forecasting
Spreadsheets and static ERP rules were never designed for a demand signal made mostly of zeros. AI-driven inventory optimization changes three things concretely.
Forecasts and stock levels are recalculated continuously rather than at a quarterly review, so a change in consumption or supplier lead time reaches the buffer within days. Uncertainty is modeled explicitly rather than absorbed by a flat coverage rule. And anomalies surface as alerts, which means planners spend their time on decisions instead of monitoring.
The gain shows up first in forecast quality. On a portfolio of more than 10,000 references spread across 30 distribution centers, Saint-Gobain Sekurit AGR improved SKU-level forecast accuracy by 15 points after moving to AI-generated forecasts, which is what made dynamic safety stock possible in the first place.
Embed vidéo ici, voir le bloc HTML plus bas.
The rules a planner already applies by hand are part of what gets automated. Flowlity's Supply Chain automation agents turn batch sizes, weekly capacity and priority rules into proposals a planner can approve, edit or reject, instead of leaving them in a side spreadsheet nobody maintains.
"We can define prioritization rules for our production planning. For some products we want a specific batch size; for others we can't manufacture that many units per week because of production constraints. We set these rules, and Flowlity generates automated production proposals aligned with market demand."
François Mourant, Inventory & Planning Manager, Saint-Gobain Sekurit Service
The second effect is less obvious and often worth more: seasonality flattens. Glass breakage climbs with cold snaps and road grit, and a network planned on averages absorbs that by dipping in availability at the same moment every year. Sekurit AGR reports the opposite pattern after the switch, a rising availability trend with a visibly reduced seasonal impact, because the buffers now move ahead of the season instead of reacting to it.
None of this removes the planner. It moves them from reacting to shortages to arbitrating between scenarios, which is the only version of the job that scales.
The KPIs that tell you it is working
Five metrics cover most of what matters, and they only mean something read together.
- Service level or fill rate, tracked per criticality class rather than as one site-wide figure. A 95% average can hide 80% on your critical parts.
- Stockout duration, not just frequency. Duration maps directly to downtime.
- Inventory turnover, compared to the reference's own history rather than to a finished-goods benchmark.
- Inventory value tied up, split between critical and non-critical.
- Obsolescence rate, the share of references with no movement over 12 or 24 months.
The pair that actually settles the question is service level against inventory value. Moving one at the expense of the other is not a result, which is why these five belong on a single Supply Chain dashboard rather than in five separate reports. As a reference point, Saint-Gobain Sekurit AGR reports an average 97% availability rate across its 30 distribution centers, two points above the previous year.
Mature service parts organizations also split their indicators by where a problem originates rather than by department. Sekurit AGR tracks OTIF (on time in full), planning adherence, lead time and frozen zone on the upstream side; availability and forecast quality on the downstream side; stock healthiness, coverage and obsolete stock on the inventory itself; and is now building end-to-end Supply Chain cost on top. The split earns its keep because a service level miss caused upstream and one caused downstream call for completely different fixes.
Common mistakes that keep spare parts stock high
Mature organizations still fall into the same five traps. Managing spare parts with finished-goods logic. Buffering "just in case" instead of against a stated service-level target. Running the whole catalog out of a spreadsheet that nobody has time to review. Ignoring demand variability because the average looks small. And leaving replenishment policies untouched for years after the assets they were built for changed.
Fixing these usually releases cash before any new tool is bought. Our piece on predictive analytics in Supply Chain planning covers how to rebuild those policies on data rather than on habit.
From reactive stocking to controlled availability
Spare parts inventory management rewards structure more than effort. Classify on the three axes that matter, connect inventory planning to the maintenance plan that is already driving demand, and let safety stock respond to risk instead of sitting on a threshold set years ago. Do those three things and the trade-off between availability and working capital stops being a trade-off.
The companies getting this right are not holding less stock at random. They are holding different stock, and they can say why for every reference.
"Since go-live we have had a far more precise view of our stock levels, our coverage and our supply needs, which lets us anticipate stockout risks earlier and make faster, better-informed decisions. What struck me most in this project was the ability to turn large volumes of data into concrete recommendations for the operational teams."
Marion Dupacq Aregay, Supply Chain Director, Cipanguo (World of Parts)
Book a demo to see how Flowlity supports spare parts availability across multi-site networks.
Level up your supply chain with AI.
Get a demo


FAQ
Find everything you need to know right here.
How is Spare Parts Inventory Management different from regular Inventory Management?

Spare Parts demand is often intermittent and unpredictable. It requires probabilistic forecasting, dynamic safety stock, and scenario simulation. Traditional methods based on stable demand patterns are usually ineffective for spare parts environments.
What is the 80/20 rule in spare parts inventory?
The 80/20 rule, or Pareto principle, states that roughly 80% of inventory value sits in about 20% of references. In spare parts the concentration is usually sharper still, and it is the starting point of ABC classification: sort by annual consumption value, give the A class individually reviewed policies, and manage the long C tail with simpler rules.
The catch is that in spare parts the 80/20 rule alone will mislead you. Value tells you where the money is, not where the risk is. A €40 sensor that stops a production line matters more than an expensive part you can source in two days. That is why value-based classification has to be crossed with demand variability (XYZ) and operational criticality, meaning the cost of not having the part when it is needed.
Applied on its own, the rule pushes companies into overstocking cheap critical items and understocking expensive ones. Combined with criticality, it becomes a real prioritization tool.
How do you forecast demand for slow-moving spare parts?
Not with a moving average. Classic methods assume a regular demand signal, and spare parts demand is intermittent: long stretches of zero, then a sudden requirement. Averaging those zeros gives a forecast of 0.3 units a month, which is both mathematically defensible and operationally useless.
Three approaches work better, and they combine.
Methods built for intermittent demand, such as Croston's method and its variants, split the problem in two: they forecast the size of a demand when it occurs and the interval between occurrences separately, instead of smoothing both into one meaningless number.
Probabilistic forecasting produces a distribution of possible demand rather than a single point. That is what lets you set stock against an explicit service-level target: covering 99% of scenarios on a critical part, 85% on a non-critical one. Saint-Gobain Sekurit AGR improved SKU-level forecast accuracy by 15 points on a portfolio of more than 10,000 references by moving to this kind of model.
Maintenance data as a demand signal is the third lever. Preventive and condition-based maintenance plans tell you which parts will be needed and roughly when. In most organizations that information exists but stays in the computerized maintenance management system (CMMS). Connecting it to inventory planning turns part of an unpredictable demand into a scheduled one.
What KPIs should you track for spare parts inventory management?
Five metrics cover most of what matters, and they only make sense read together.
Service level or fill rate, tracked per criticality class rather than as one site-wide figure, because a 95% average can hide 80% on your critical parts. Stockout frequency and duration, with duration the more telling of the two since it maps directly to equipment downtime. Inventory turnover, expected to be low on spare parts and best compared to a reference's own history rather than to a finished-goods benchmark. Inventory value tied up, split between critical and non-critical parts. And the obsolescence or slow-moving rate, the share of references with no movement over 12 or 24 months, which is where hidden losses accumulate.
The pairing that tells you whether the policy is working is service level against inventory value. Improving one at the expense of the other is not a result. Saint-Gobain Sekurit AGR moved both at once: service level from 95.8% to 97.2% while inventory fell 9%.
Are spare parts inventory or fixed assets?
It depends on how the part is used, and the split matters because it changes both your balance sheet and who is accountable for the stock.
Under the International Financial Reporting Standards (IFRS), parts consumed in the ordinary course of maintenance are inventory under IAS 2, and their cost hits the income statement when they are used. Major spare parts and stand-by equipment are capitalized as property, plant and equipment under IAS 16 when the company expects to use them over more than one period, or when they can only be used in connection with a specific asset. A spare turbine held for one production line is typically property, plant and equipment. A stock of bearings and seals is inventory. US Generally Accepted Accounting Principles (GAAP) reach a comparable outcome through the same use-based logic.
In practice the frontier is drawn by the expected holding period and by whether the part is dedicated to a single asset. Insurance spares, held for years against a low-probability failure on a critical machine, are the classic capitalization case.
This describes common accounting treatment, not accounting advice: confirm the classification of your own spare parts with your auditor.
What is the best software for managing spare parts inventory?
There is no single best tool, because three categories solve three different problems and most companies end up needing two of them.
A computerized maintenance management system (CMMS) manages maintenance: work orders, equipment history, and the parts consumed on each intervention. It knows what was used and where the stock physically sits. It is the right system of record for maintenance, and it is generally not built to decide how much to hold.
An enterprise resource planning (ERP) or warehouse management system (WMS) handles transactions and movements: receipts, issues, valuation, locations. It executes replenishment rules, but the rules themselves are usually static min/max thresholds that someone set once and rarely revisits.
An inventory optimization or supply planning tool decides the quantities: it forecasts intermittent demand, calculates safety stock per part against a service-level target, and recalculates as consumption and lead times shift. This is the layer most companies are missing, and it is why spare parts stock keeps growing while stockouts persist.
The useful question is therefore not which tool is best, but which layer you are missing. If you know what you consumed but not what to hold, the gap is in decision intelligence, not in tracking. Flowlity sits in that third category, and the spare parts planning page shows how it works alongside an existing ERP or CMMS.